Documentation
Getting started for using LabPi in your lessons. Click the headings to expand the chapters.
Download the documentation
You can download a printable PDF version of this documentation here.
Chapter overview
This section describes two ways to install LabPi. This is only necessary if you want to build the measuring station yourself. Purchased LabPi stations are preset and do not require the steps described.
This section describes how to write a microSD card when an image file (.img) from LabPi is available. The image file indicates the preinstalled LabPi version with version number (e.g. LabPi_0_210.img). The latest image can be downloaded here (16 GB).
Required hardware
- PC/laptop with Windows operating system
- SD card reader
- microSD card (16 GB)
- Raspberry Pi 3 or higher
Required software
- SDFormatter
- Win32 Disk Imager
Describe microSD card
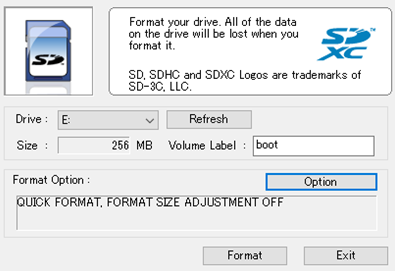
- First, the microSD card must be formatted. To do this, the SDFormatter program is opened.
- The drive of the microSD card is selected as "Drive" (if not done automatically).
- Enter “boot” under volume label.
- Pressing the “Format” button begins formatting the microSD card.
- Once formatting is complete, SDFormatter can be closed.
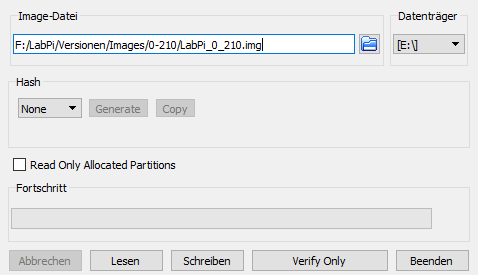
- Open the Win32 Disk Imager program.
- The image to be copied is selected under "Image file" (LabPi_0_210.img).
- The drive of the microSD card is selected as the "data storage medium" (here: H:)
- By confirming the “Write” button, the microSD card is written.
As soon as writing to the microSD card is finished, the microSD card can be transferred to the Raspberry Pi. All other settings are preset so that LabPi can be started.
This section describes how to install LabPi on a Raspberry Pi with a Raspberry Pi OS already installed. LabPiFull.zip can be downloaded here (43 MB).
Required hardware
- PC/laptop with Windows operating system
- SD card reader
- microSD card
- Raspberry Pi 3 or higher
- USB stick
Required software
- Raspberry Pi Imager
Set up LabPi
The steps described here are only for installation for LabPi. Raspberry Pi OS should have been installed on the microSD card as specified by the official Raspberry Pi Imager. After starting the Raspberry Pi, you can follow the setup wizard to set network settings, language, etc.
- The LabPiFull.zip files are unpacked onto a USB stick.
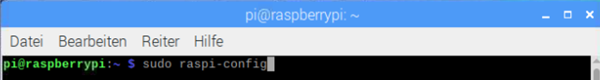
- The LXTerminal opens on the Raspberry Pi.
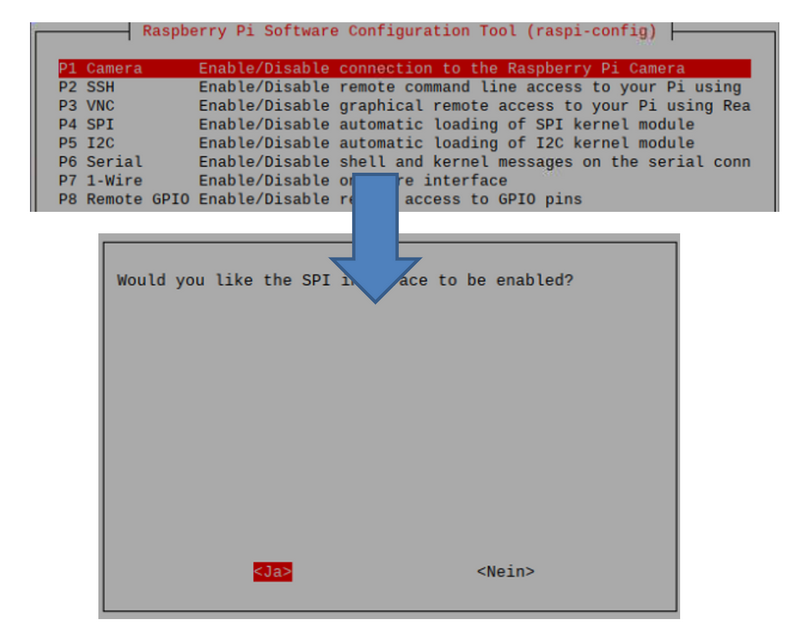
- The command sudo raspi-config opens the configuration menu.
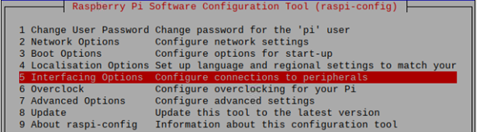
- The connections for sensors are enabled under the menu item “Interfacing Options”.
- SPI, I2C and 1-Wire are each selected one after the other and activated with "Yes"/"Yes".
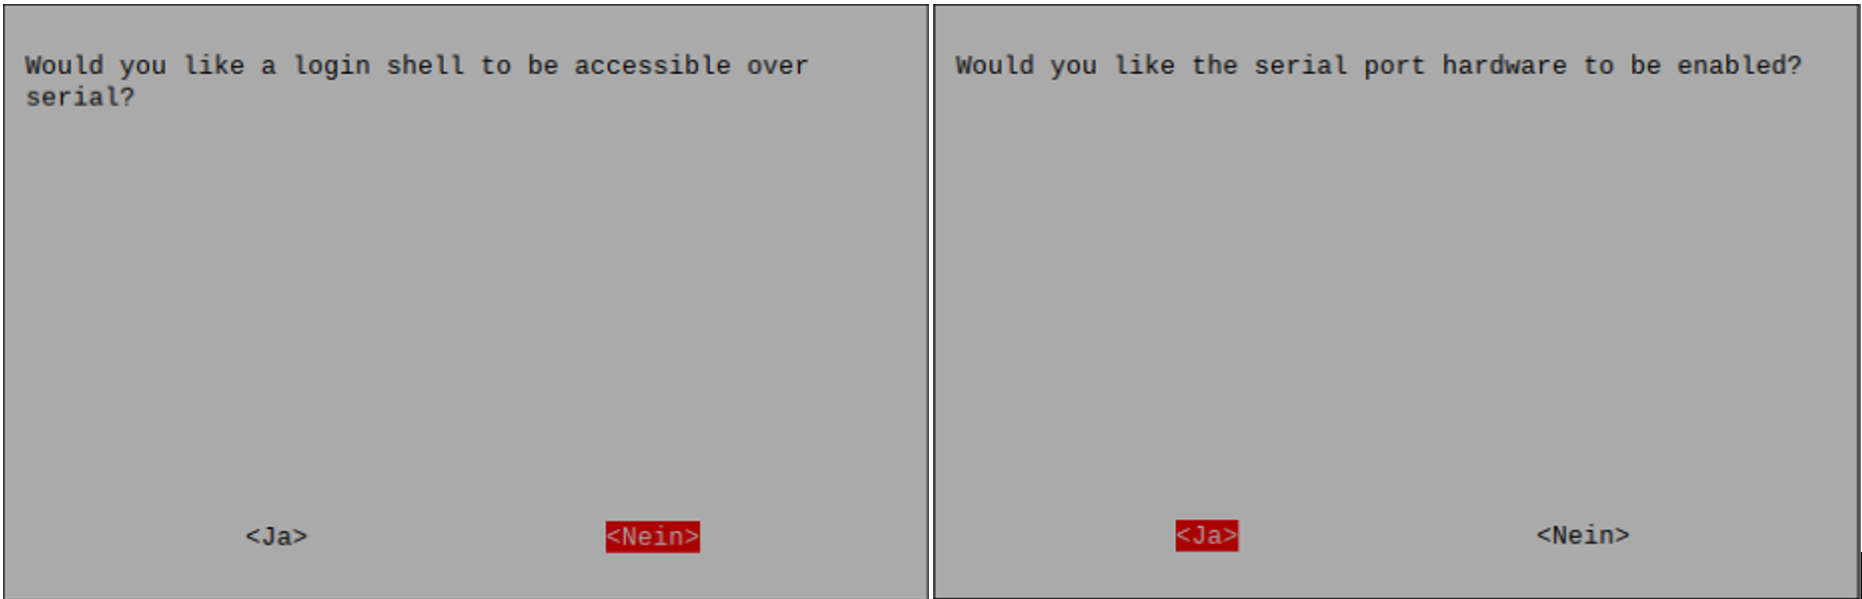
- For the serial port, the first message is given as "No" and the second is given as "Yes" to activate the port.
- The configuration menu can now be closed.
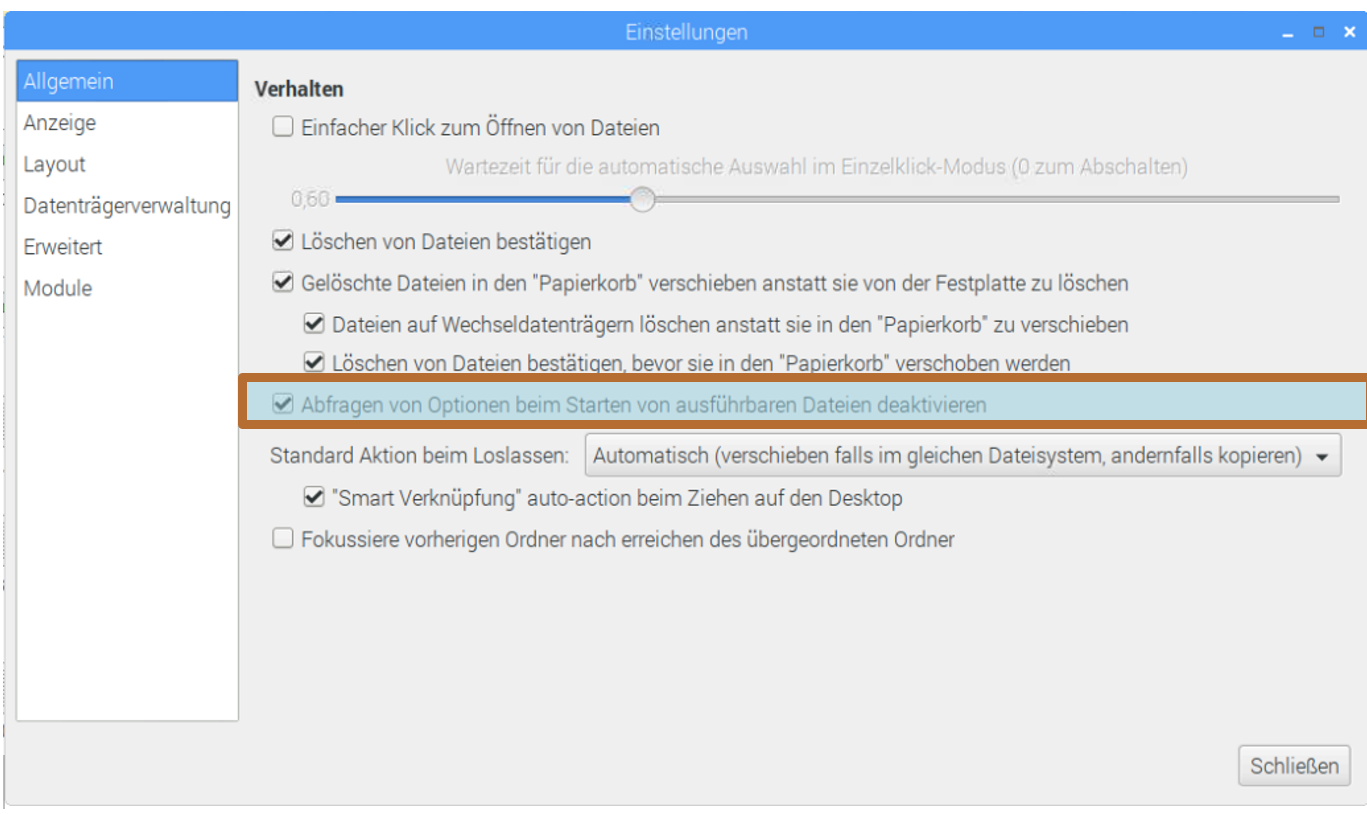
- The file manager will now open.
- Open the settings under Edit.
- In order not to receive a message when starting up whether LabPi should be started, check the box "Disable querying for options when starting executable files".
- The settings and the file manager can be closed.
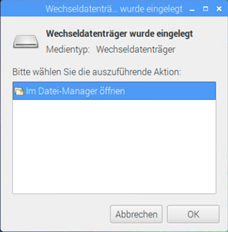
- Connect the USB stick with LabPi to the Raspberry Pi.
- A window opens in which "Open in file manager" is selected and then confirmed with "OK".
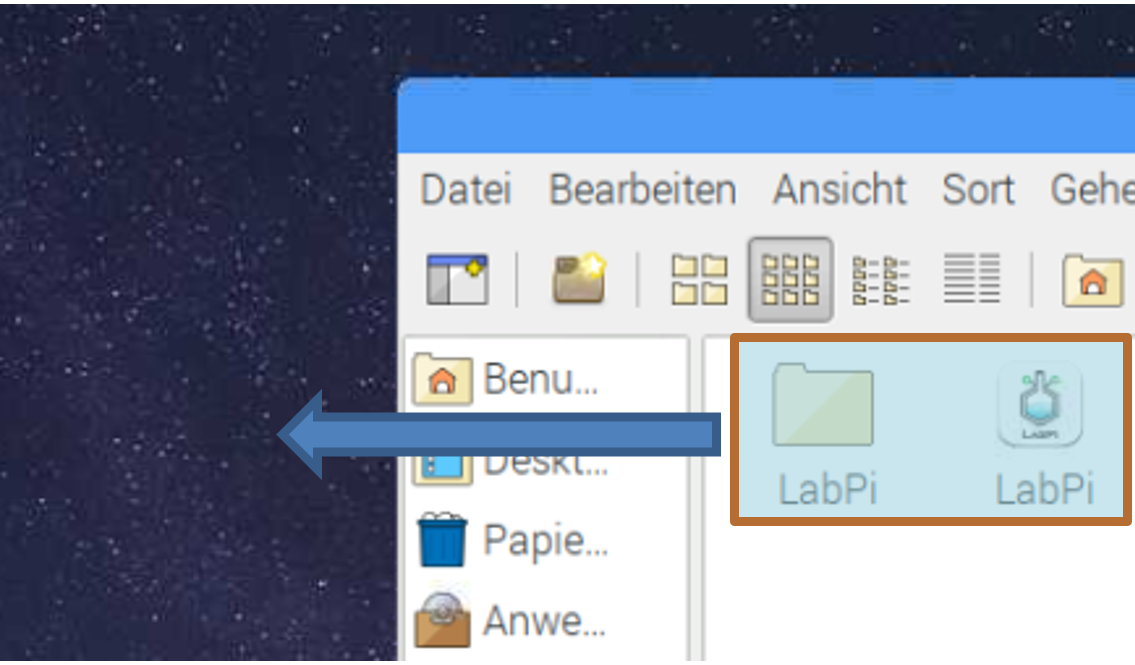
- Drag the LabPi.desktop file and the LabPi folder to the desktop.
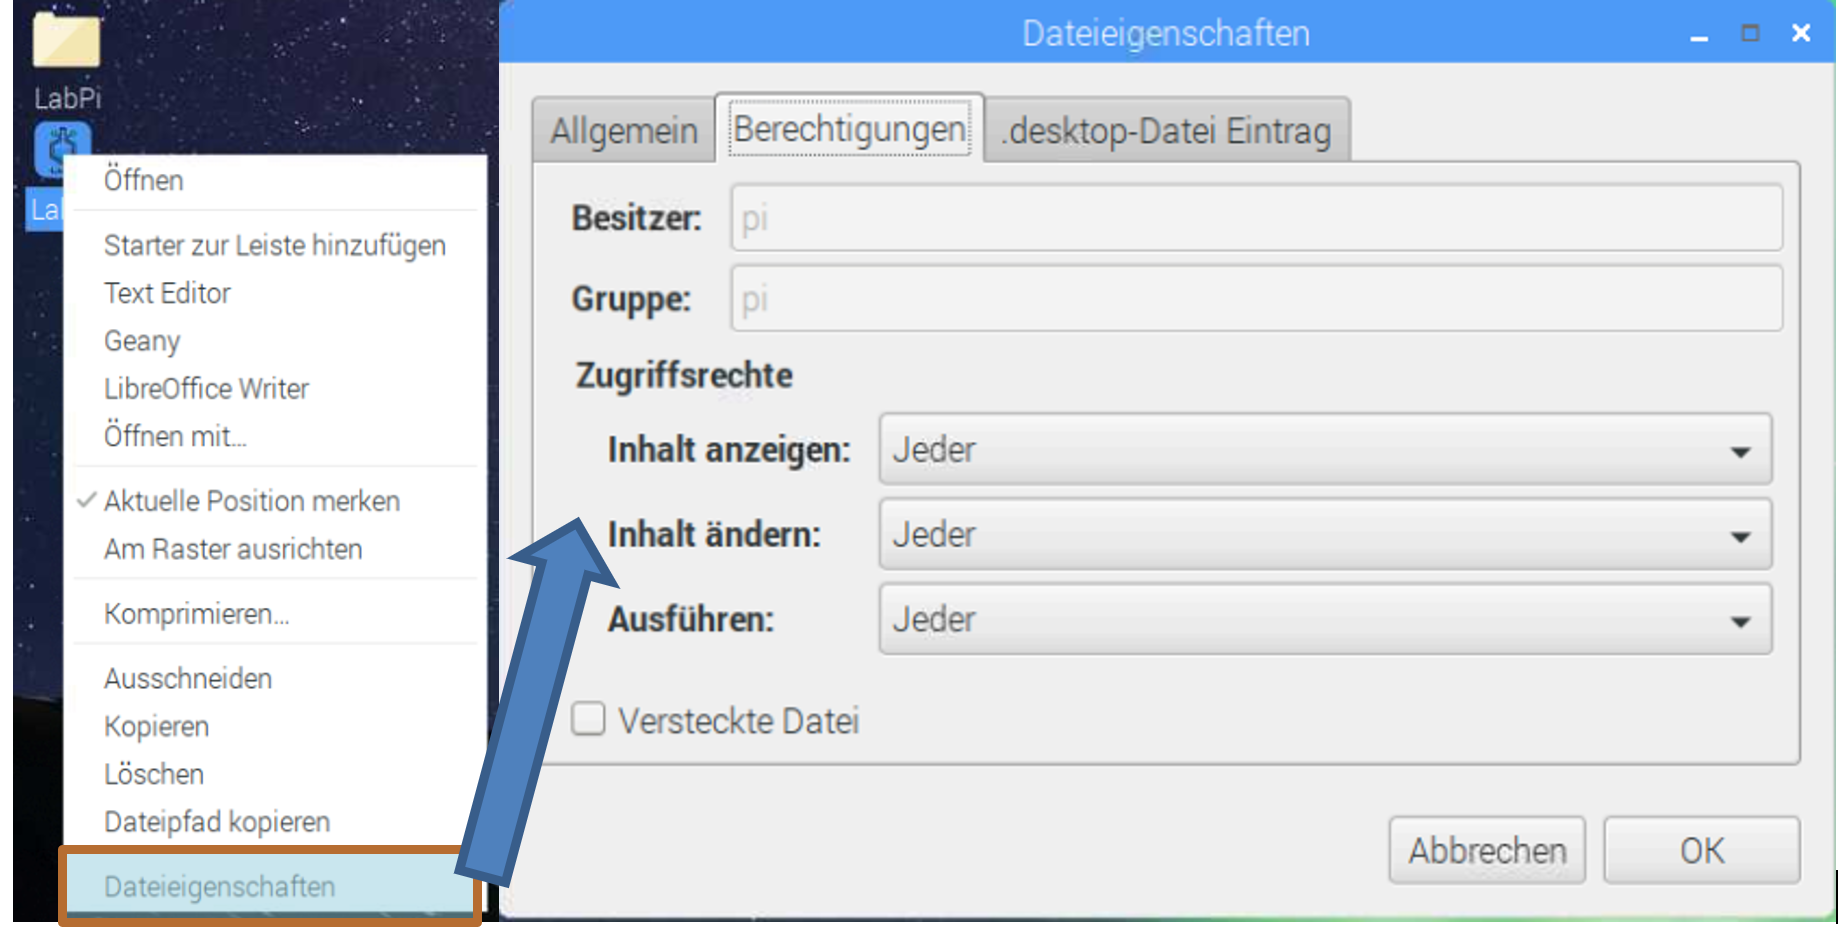
- Right-click on the file LabPi.desktop to open the file properties.
- Set the permissions to "Everyone" and confirm with "OK".
- Open the "LabPi" folder and open the file properties of the "LabPi" file.
- Set the permissions to "Everyone" and confirm with "OK".
- Open the "update" folder and open the file properties of the "Updater" file.
- Set the permissions to "Everyone" and confirm with "OK".
- Now start the Raspberry Pi.


If the desktop icon does not correspond to the LabPi logo, proceed as follows:
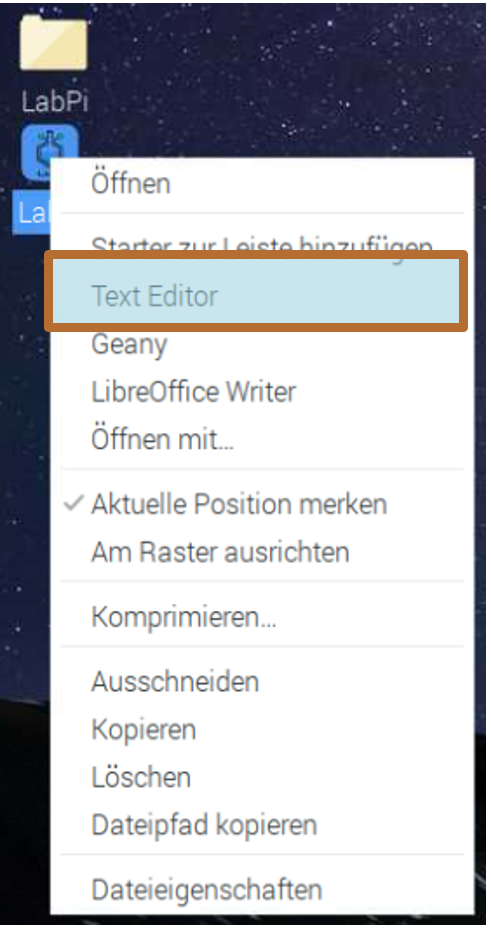
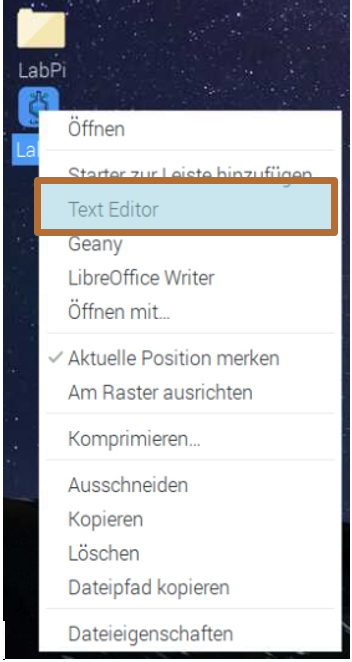
- Right-click on the LabPi.desktop file to open the text editor.
- In the lines "Icon" and "Exec" replace the words "Desk" with "Desktop".
- Save the file and restart the Raspberry Pi.
- LabPi can now be started via the desktop.
In this section, the essential controls of LabPi are described and explained. Please note that some features are not yet fully available. These features are therefore marked with a * and will be expanded or added in later versions of the software.
If LabPi is available via a pre-configured SD card, no further configuration is necessary before using the software. After the Raspberry Pi has successfully booted up, all you have to do is double-click the shortcut on the desktop to start.
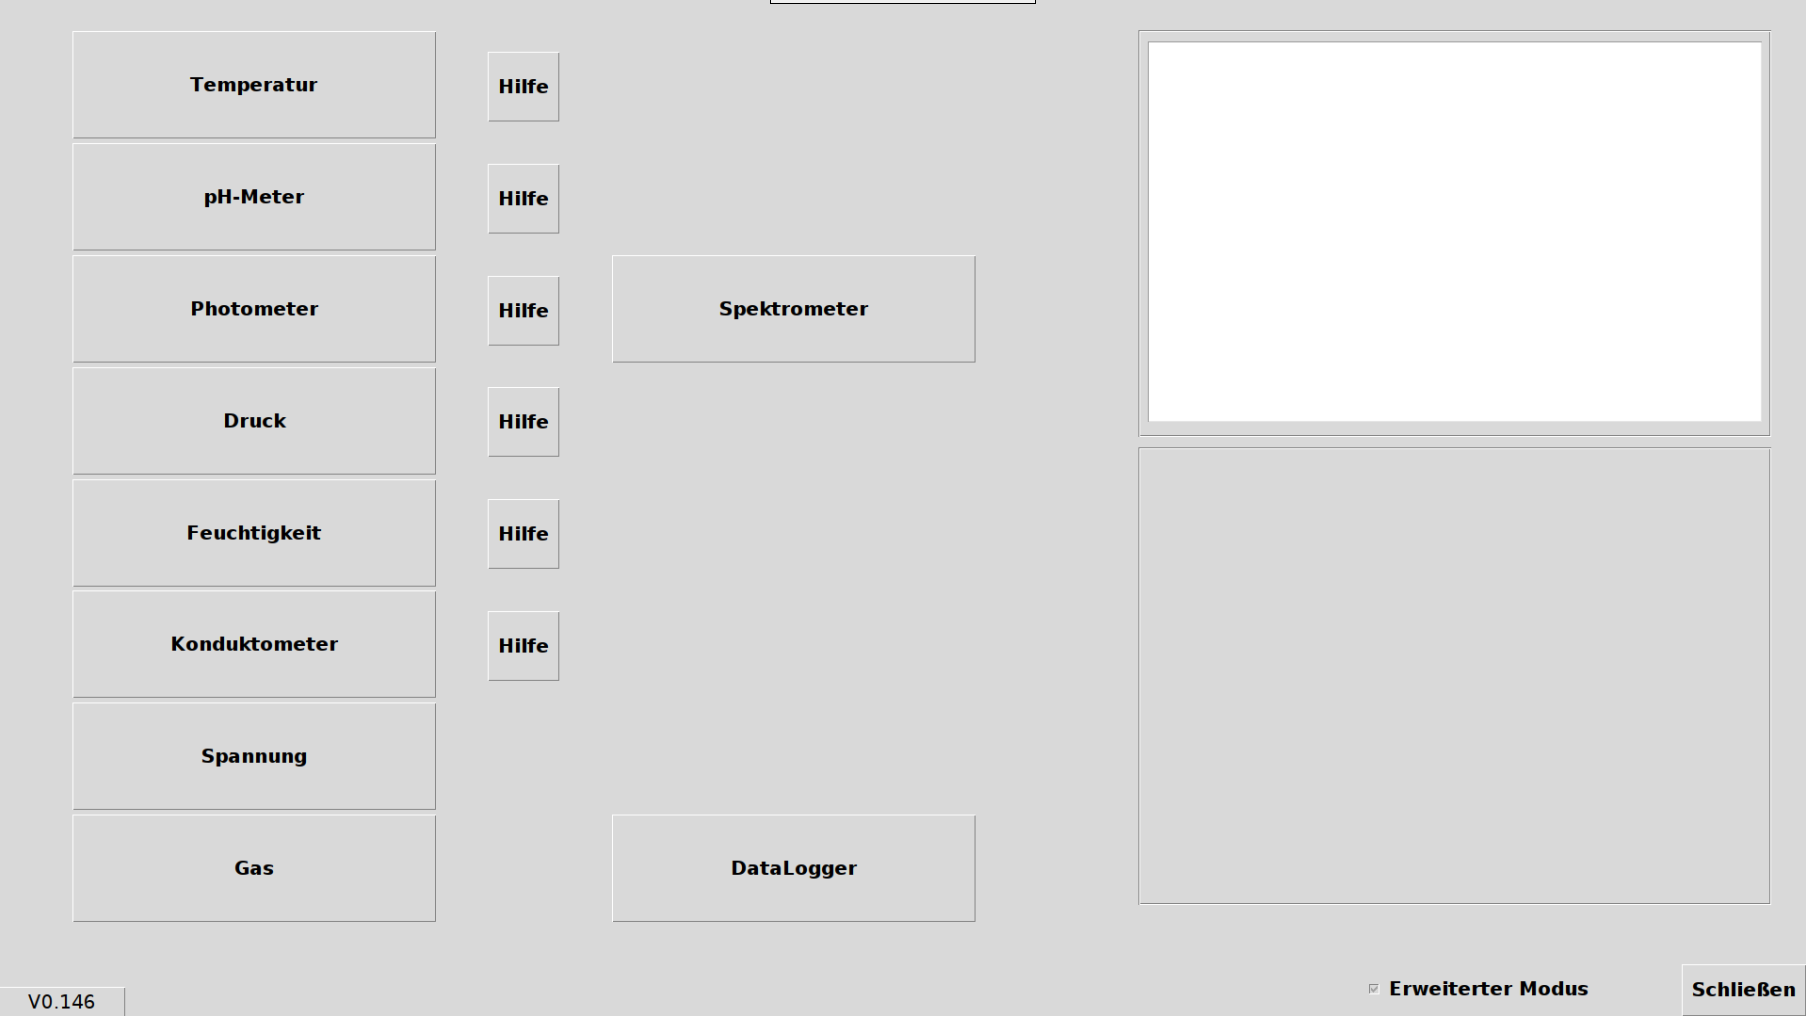
The main menu serves as orientation when using a main sensor. The Help shows you how to connect the selected sensors to the Raspberry Pi. Alternatively, you can find an overview of the individual sensors in this manual in Section 4.
As soon as the sensor is connected, the desired measuring surface can be started. To do this, click on the desired measuring device. To get back to the main menu, you can use the “Back” button in the top right area of the measurement interfaces.
To close LabPi, press the "Close" button at the bottom right of the main menu or press Alt+F4 on the keyboard.
As soon as LabPi establishes a connection to the Internet, new updates are automatically checked. These are identified by a note in the bottom left area of the main menu.
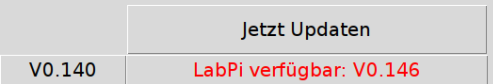
By pressing the Update now button, the update software is started, with which LabPi is updated to the current version.
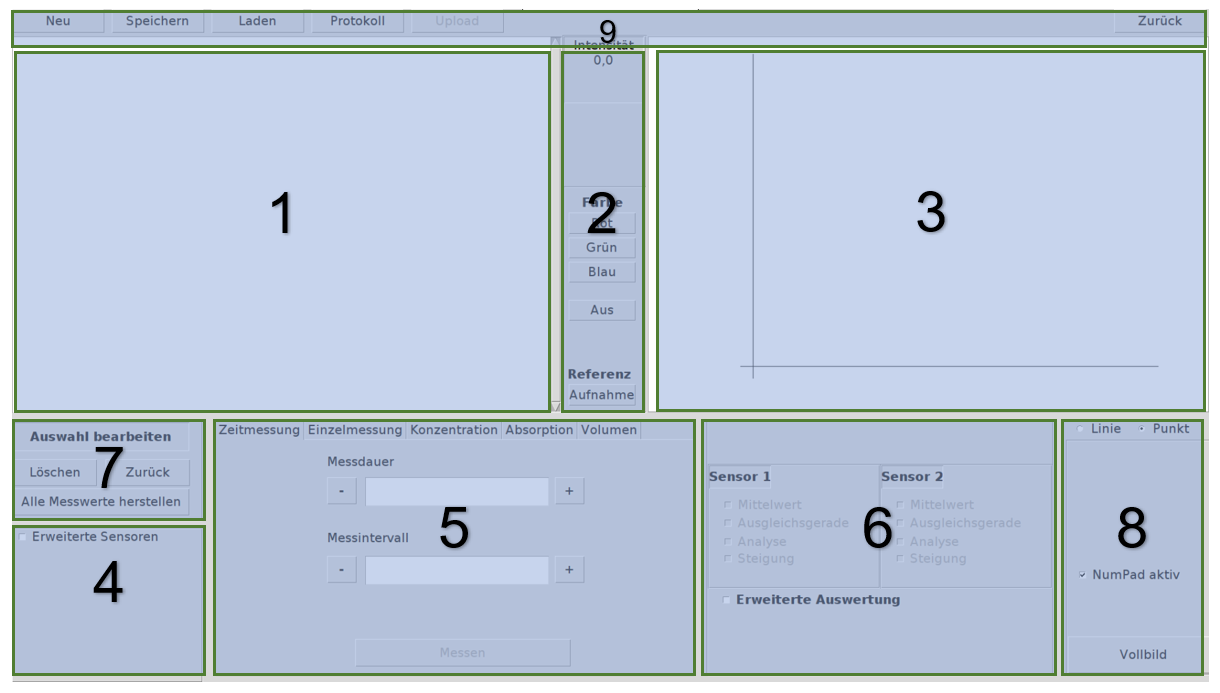 The measurement surface consists of several elements:
- Text output
- Real-time measurement
- Plotters
- Advanced sensors
- Measuring methods
- Evaluation
- Edit selection
- Display options
- Export and import
These elements are described in the following chapters.
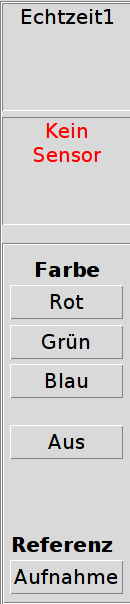
Individual measurement variables are listed in the text output. These can be edited after the end of a measurement routine (more on this in Chapter 3.7: Datalogger). The text output is updated automatically and in parallel to the measurement routine.
The current measured variables from the sensors are displayed in this area. When working with the photometer, the respective color of the emitted light can be set here and the reference value can be recorded.
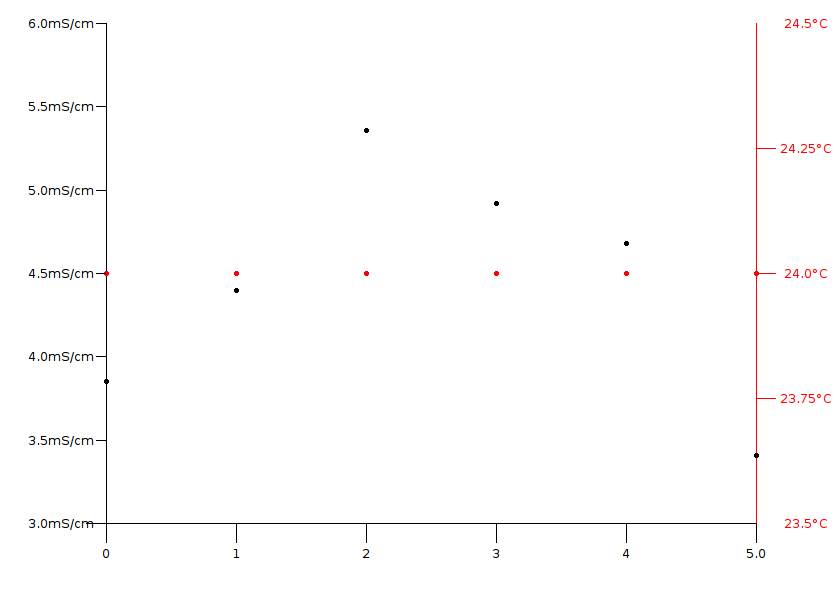
The measured variables are displayed graphically in a diagram in the plotter. When measuring with two sensors, the color coding is as follows:
- Black: Knife points of sensor 1
- Orange: Knife points of Sensors 2
- Blue: Slope of the selected sensor (see also chapter 2.6)
- Green: Analysis of the selected sensor (see also Chapter 2.6)
- Red: Slope of the selected sensor
- Gray: Average value of the selected sensor
For a second sensor, a second y-axis is displayed in the right area of the plotter.
In order to add another sensor, the “Advanced sensors” selection must first be active.
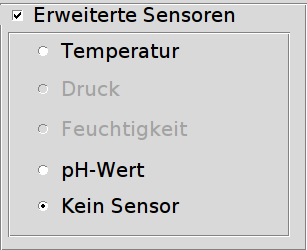
LabPi automatically detects which sensors can be switched on or which are inactive (gray background). With combined sensors (such as the BMP180 pressure sensor), it can happen that a second sensor is displayed as active without further connection, as these are integrated in the sensor.
Another sensor is added by clicking on the selected sensor. The real-time measurement for sensor 2 then automatically reflects the current measurement variable for the second sensor.
LabPi currently has 6 measuring methods, which can be selected via the selection in the upper area.
The operation of the individual measuring methods is described in more detail in Section 4.
After recording a series of measurements, several evaluation options become active here.
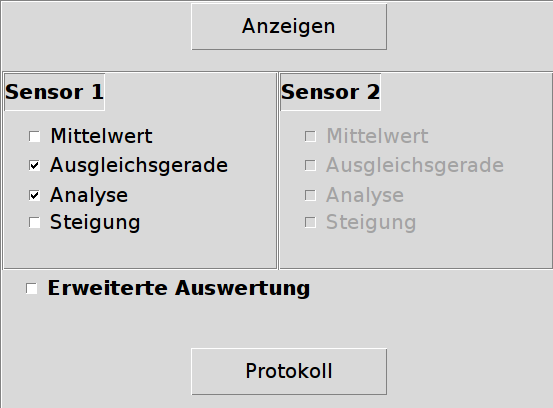
By checking the box, the evaluations are activated and displayed automatically. The duration of the display can take a little longer in some cases, as calculation processes take more time, especially when there are many measuring points. In the lower area of the plotter, the respective results for the selected sensor can be displayed.
*Using the “Protocol” button, a form can be created on the “LabPi COMPare” web interface for direct logging of the experiment, see Section 5.*
In the Edit selection control panel, measuring points can be removed manually.
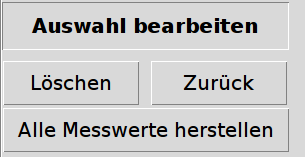
To do this, the unwanted measurement variable is first selected from the text output. This can then be removed using the Delete button. The text output, the plotter and all selected evaluations are then updated.
*The last deleted measurement variable is restored using the Back button. All deleted measurements can be restored using the Restore all measured values button. *
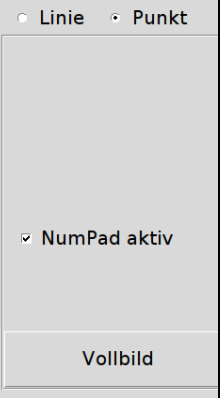
- Line
Lets the plotter connect the measuring points with lines - Point
Lets the plotter display the measurement points as points - Full Screen
Lets the plotter display in full screen. "Measure" starts a measurement in full screen mode with the parameters previously selected in the measurement method. "Off" leaves full screen mode and gives access to all controls again.
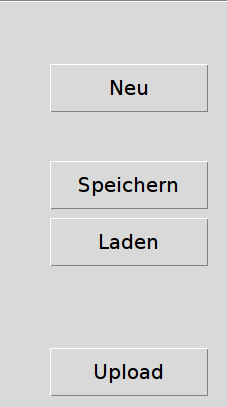
- New
The "New" button is used to reset all measured variables. It is advisable to activate this after each experiment before new measurements are recorded. - Save
By pressing the "Save" button, measurement data can be saved to the local storage or optionally to a USB stick.
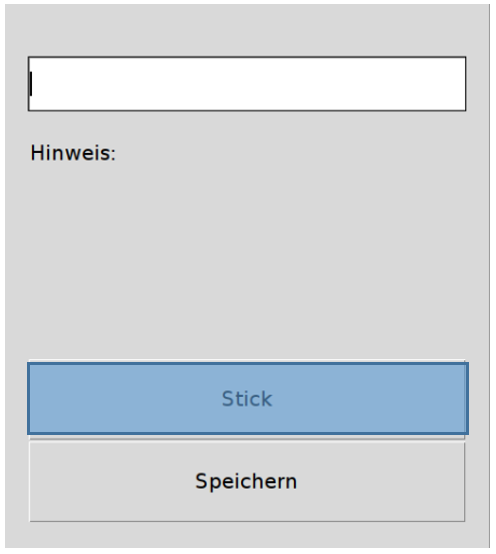
The measurement data will be saved under the desired file name after confirmation.
LabPi creates four files with the following encoding:
- [File name].txt
This text file contains the measurement data as displayed in the LabPi text field. - [File name].jpg
This is an image file from the plotter, including the previously defined evaluation options. - [File name].bkup
This file is used to load previous measurement records - [File name]Office.txt
This file is used to import measurement records into any spreadsheet program (e.g. Excel)
Pressing the Stick button opens another section. Connected USB sticks are listed here and can be selected for saving. You can save here using the Save button at the bottom right.

- Load button
Pressing the "Load" button makes it possible to call up saved (local) measurement series. To do this, a window first opens in which the measurement to be opened can be selected and accessed using the "Open" button. LabPi then displays the measurement in tabular and graphical form.
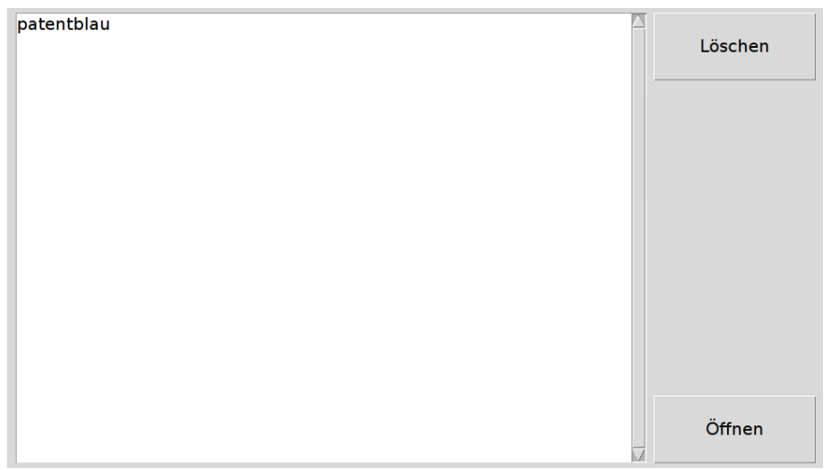
By pressing the "Delete" button, a selected measurement is deleted.
- Upload button
Using the “Upload” button, measurement series can be uploaded to “LabPi COMPare”. (see Section 5)
This section describes how to use the LabPi measurement methods.
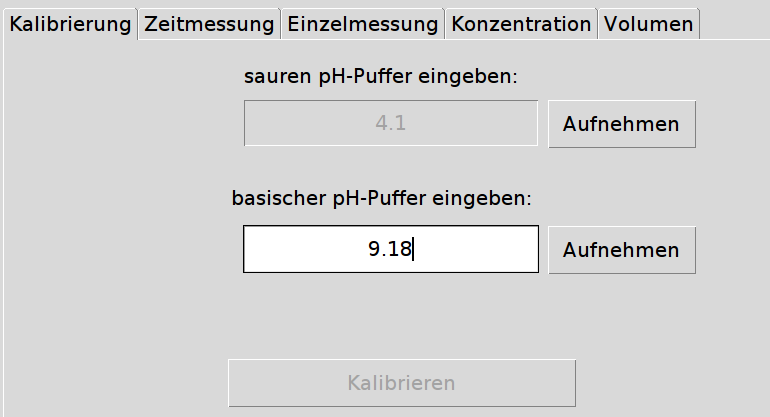
Some electrodes (such as pH and conductivity electrodes) must be calibrated before first use and should be calibrated before each series of measurements. The Calibration method is required for this. A measuring electrode is calibrated in the respective program in which the desired sensor is selected as the 1st sensor. For pH electrodes, the menu item pH meter will first be selected in the main menu. In the following example, two buffer solutions with a pH value (at 20°C) of pHacid = 4.1 and pHbasic = 9.18 are used. The information can be found in the respective buffer solution.
- Prepare tempered buffer solutions in one beaker each.
- Enter the read pH value of the buffer solution in LabPi under enter acidic pH buffer.
- Rinse pH electrode with distilled water.
- Immerse the pH electrode in the beaker containing acidic buffer solution (stir a little if necessary). Press Record button - LabPi has recorded the data when the field for alkaline buffer solution and the associated Record button were released.
- Enter the read pH value of the buffer solution in LabPi under enter basic pH buffer.
- Remove the pH electrode from the buffer solution and then rinse with distilled water.
- Immerse the pH electrode in the beaker containing alkaline buffer solution (stir a little if necessary). Press the
- Record button – The Calibrate button is released as soon as the data has been recorded.
- Calibration takes place by confirming the Calibrate button. The pH value of the real-time measurement will now show the correct pH value.
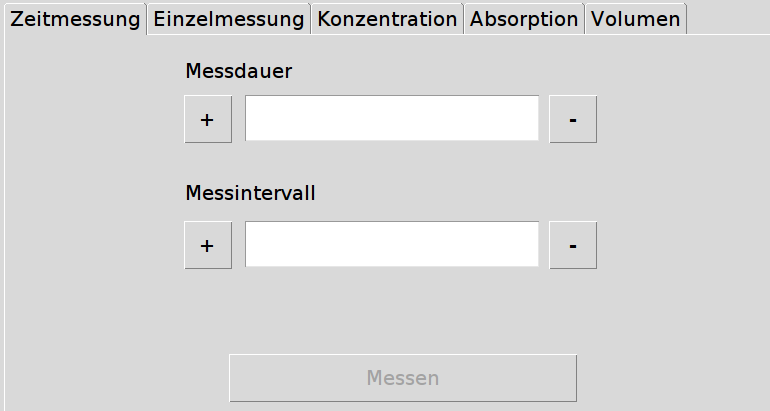
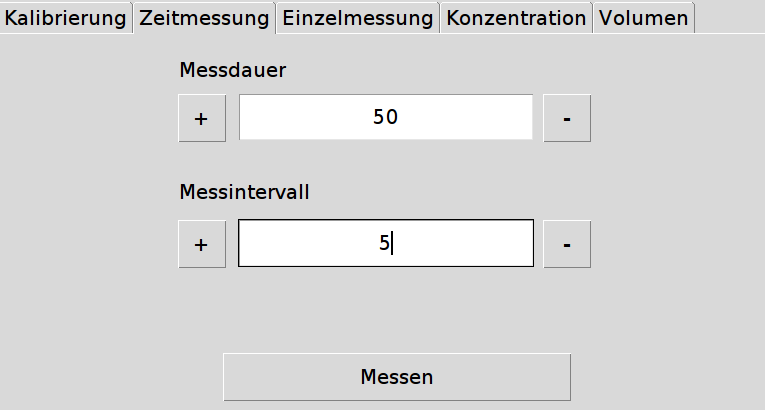
Time-dependent measurements can be carried out under the menu item Time measurement. To carry out a time measurement, first select the desired sensor in the main menu.
- (Optional) Add a second sensor.
- Enter the total duration of the measurement in seconds under Measuring time (e.g. 50). You can also use the + / - button for this.
- Under Measuring interval, enter the time after which a measurement should be recorded (e.g. for every 5 seconds 5). You can also use the + / - button for this.
- Press the Measure button to start the measurement. LabPi then begins to record and display the measured variables.
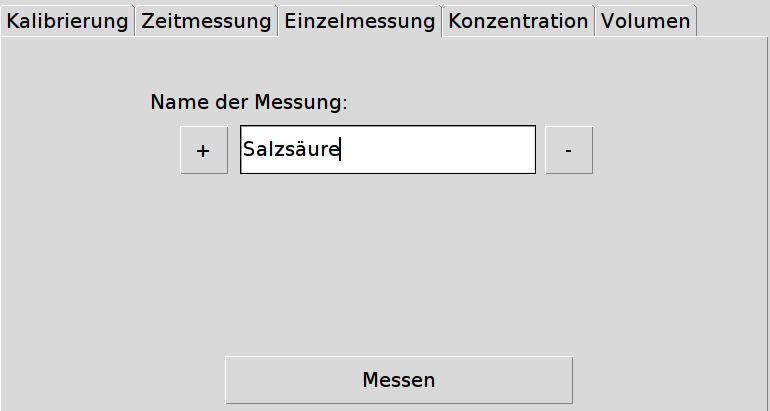
Under the Individual measurement menu item, individual, independent measurements can be carried out, for example to compare pH values of different substances with one another. To carry out an individual measurement, first select the desired sensor in the main menu.
- (Optional) Add a second sensor.
- Enter the substance that is to be measured under Name of measurement (e.g. Hydrochloric acid). You can also use the + / - button if coding with numbers is sufficient for this measurement.
- Press the Measure button to record the measurement variable. LabPi will record and display the measured variable.
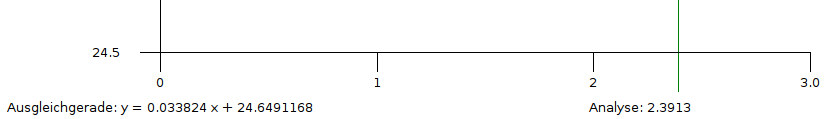
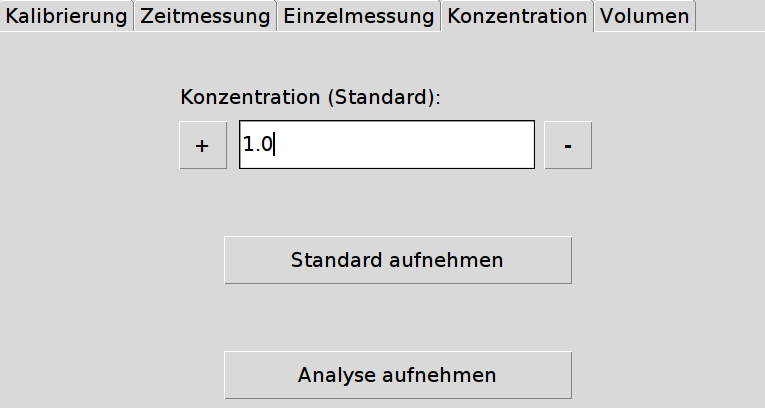
Concentration determinations can be carried out under the menu item Concentration. To carry out a concentration determination, first select the desired 1st sensor in the main menu.
- (Optional) Add a second sensor.
- Enter the concentration of the standard solution to be determined under Concentration (standard) (e.g. for c = 1 mol / L 1). You can also use the + / - button for this.
- Press the Record standard button to carry out the measurement. LabPi then begins to record and display the measured variables. The Record analysis button becomes active as soon as enough measured variables have been recorded to determine the concentration.
- (Optional) You can have a best fit line displayed by activating the best fit line from the evaluation options (3.2.6) and then pressing the Show button.
- (Optional) You can determine an analysis by clicking the Record analysis button.
- (Optional) To display the analysis graphically, activate the best fit line and analysis from the evaluation options (3.2.6) and then press the Show button. The analysis is displayed in green on the best fit line.
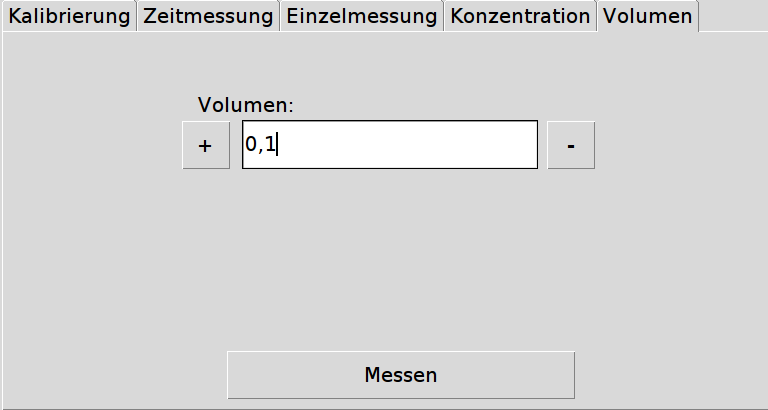
For example, neutralization titrations can be carried out under the menu item Volume. To carry out a volume-dependent measurement, first select the desired sensor in the main menu.
- (Optional) Add a second sensor.
- Under Volume, enter the interval with which you want to determine the volume (e.g. for 0.1 mL intervals 0.1).
- Press the Measure button to carry out the measurement. LabPi then begins to record and display the measured variables.
- If the volume interval changes during a series of measurements, the input must be set to the new interval (see 2.) before you press the Measure button again. If the interval remains the same, the entry remains unchanged and the Measure button can be pressed.
- (Optional) You can have a best fit line displayed by activating the best fit line from the evaluation options (3.2.6) and then pressing the Show button.
- (Optional) You can display the slope by activating the Slope from the evaluation options (3.2.6) and then pressing the Show button.
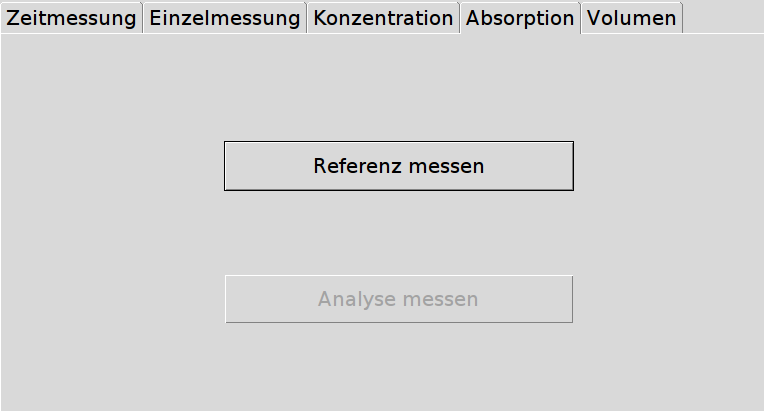
The menu item Absorption is only available as the first sensor for the photometer and can only be used effectively if more than one emitting light source is connected to the Raspberry Pi. To do this, select the photometer in the main menu.
- Place a reference sample in the beam path of the photometer.
- Press the Measure reference button to record reference values. After the measured variables have been recorded, the Measure analysis button becomes active.
- Take the reference sample from the beam path.
- Place the sample to be analyzed in the beam path.
- Press the Measure Analysis button. LabPi will display the absorption graphically and listed in order to make the absorption maximum determinable.
The Datalogger function is listed in the main menu. This function enables the acquisition of measurement data without graphical representation and offers the possibility for large long-term measurements or the simple representation of one or more measured variables.
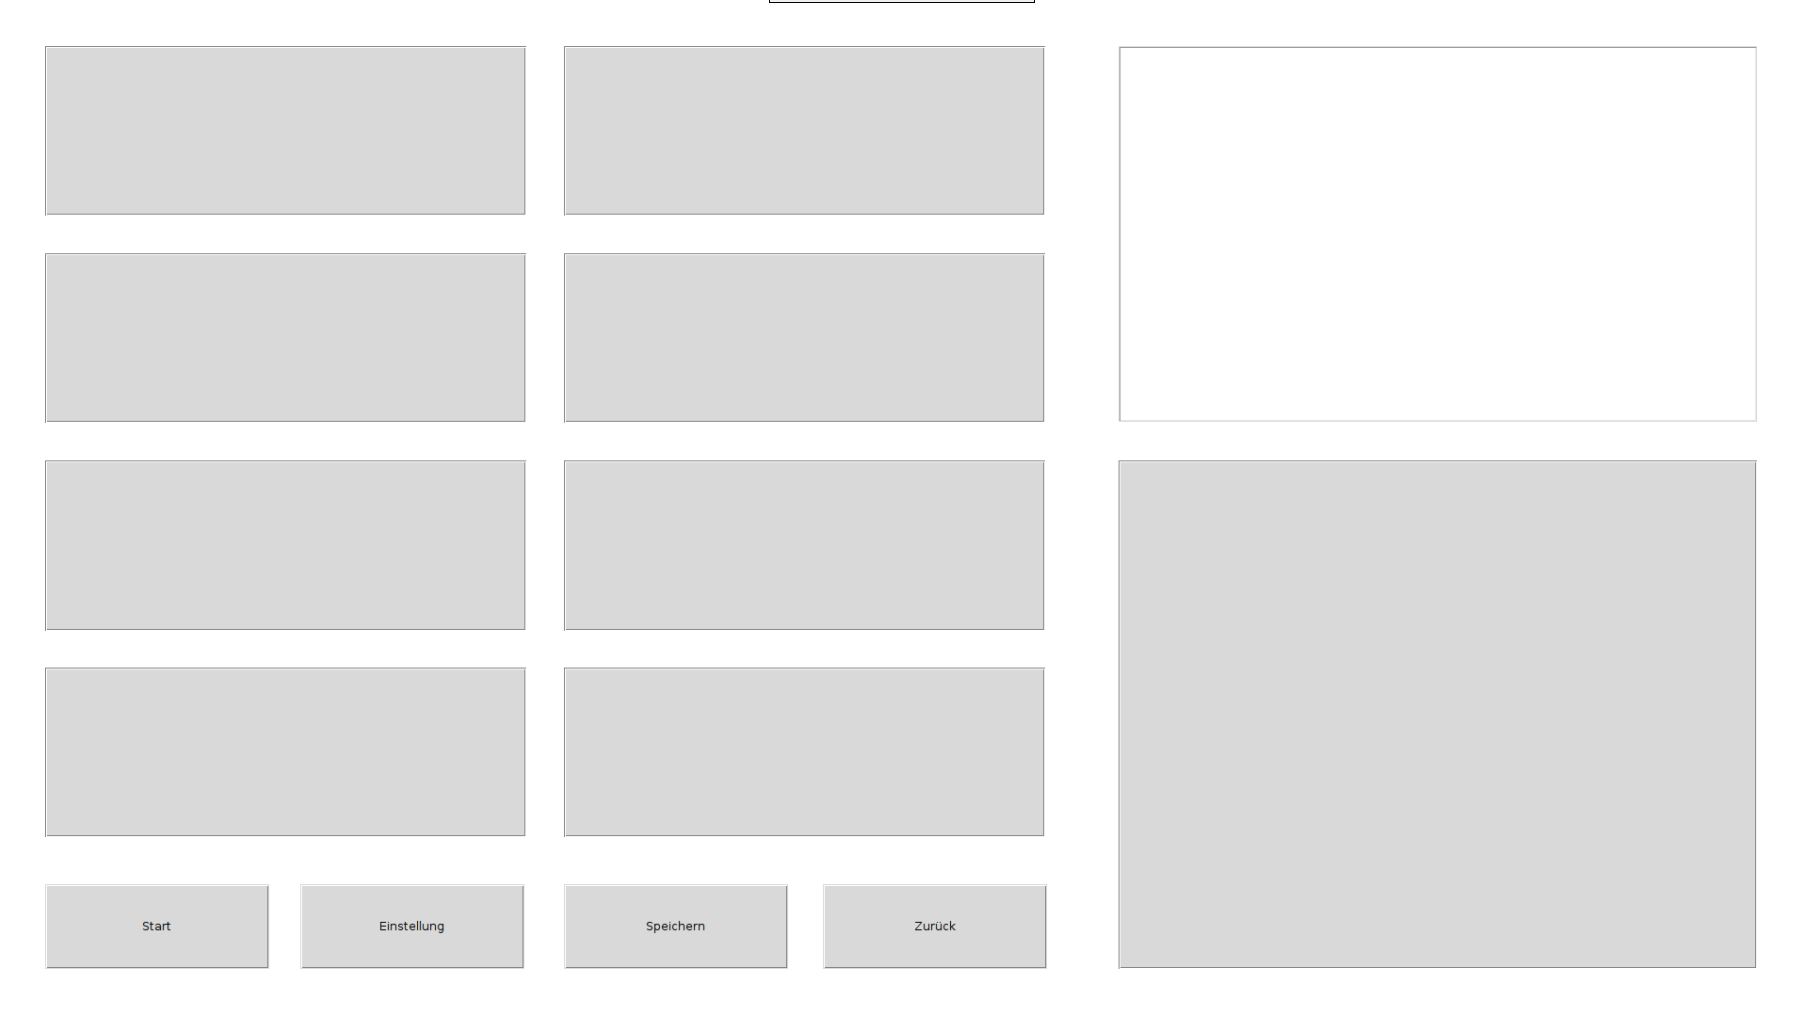
The current measurement data can be displayed in the tiles of the data logger by pressing on a free tile. A new window opens from which various sensors can be selected.
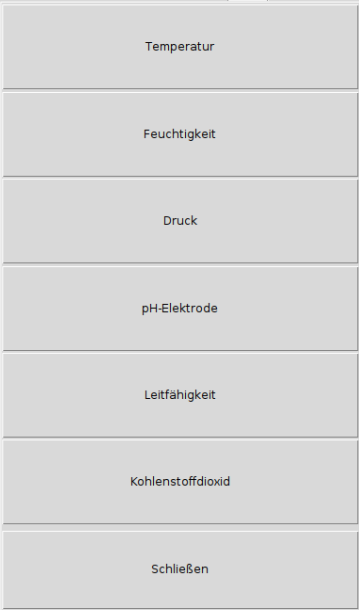
After selecting a sensor, the measured value is displayed in real time in the respective tile.
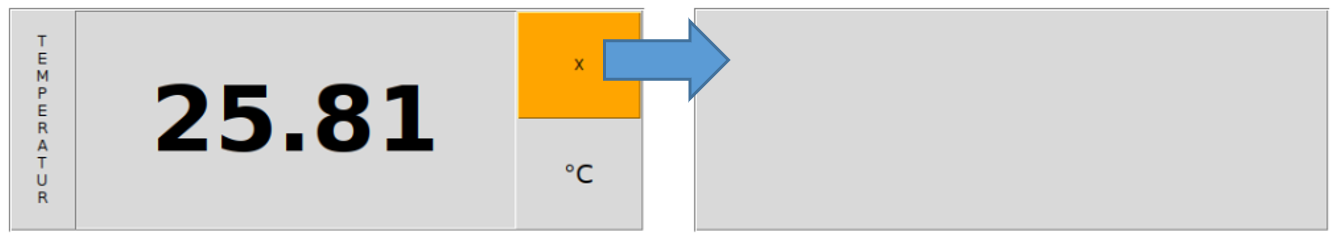
With the orange button (X) the tile can be unlocked again and used for another sensor.
The time interval for long-term measurements can be set under Settings.
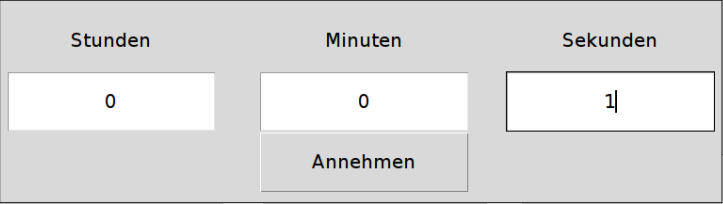
Changes to the interval are accepted by pressing the Accept button.
A long-term measurement can be started using the Start button. Once pressed, this switches to the Stop button to end a measurement. Completing a measurement may take a short moment because data that has not yet been saved is being recorded. Saving is done as described in Section 2.9.
LabPi allows different sensors to be connected in different ways. These differ according to the adapter board and connections.
- Adapter board version 1: see AP1: EZBoard-G (USB Type A)
- Adapter board version 2: see AP2: EZBoardMini (USB Type C)
- The options for directly connecting the sensors without an adapter board are explained in the following sections.
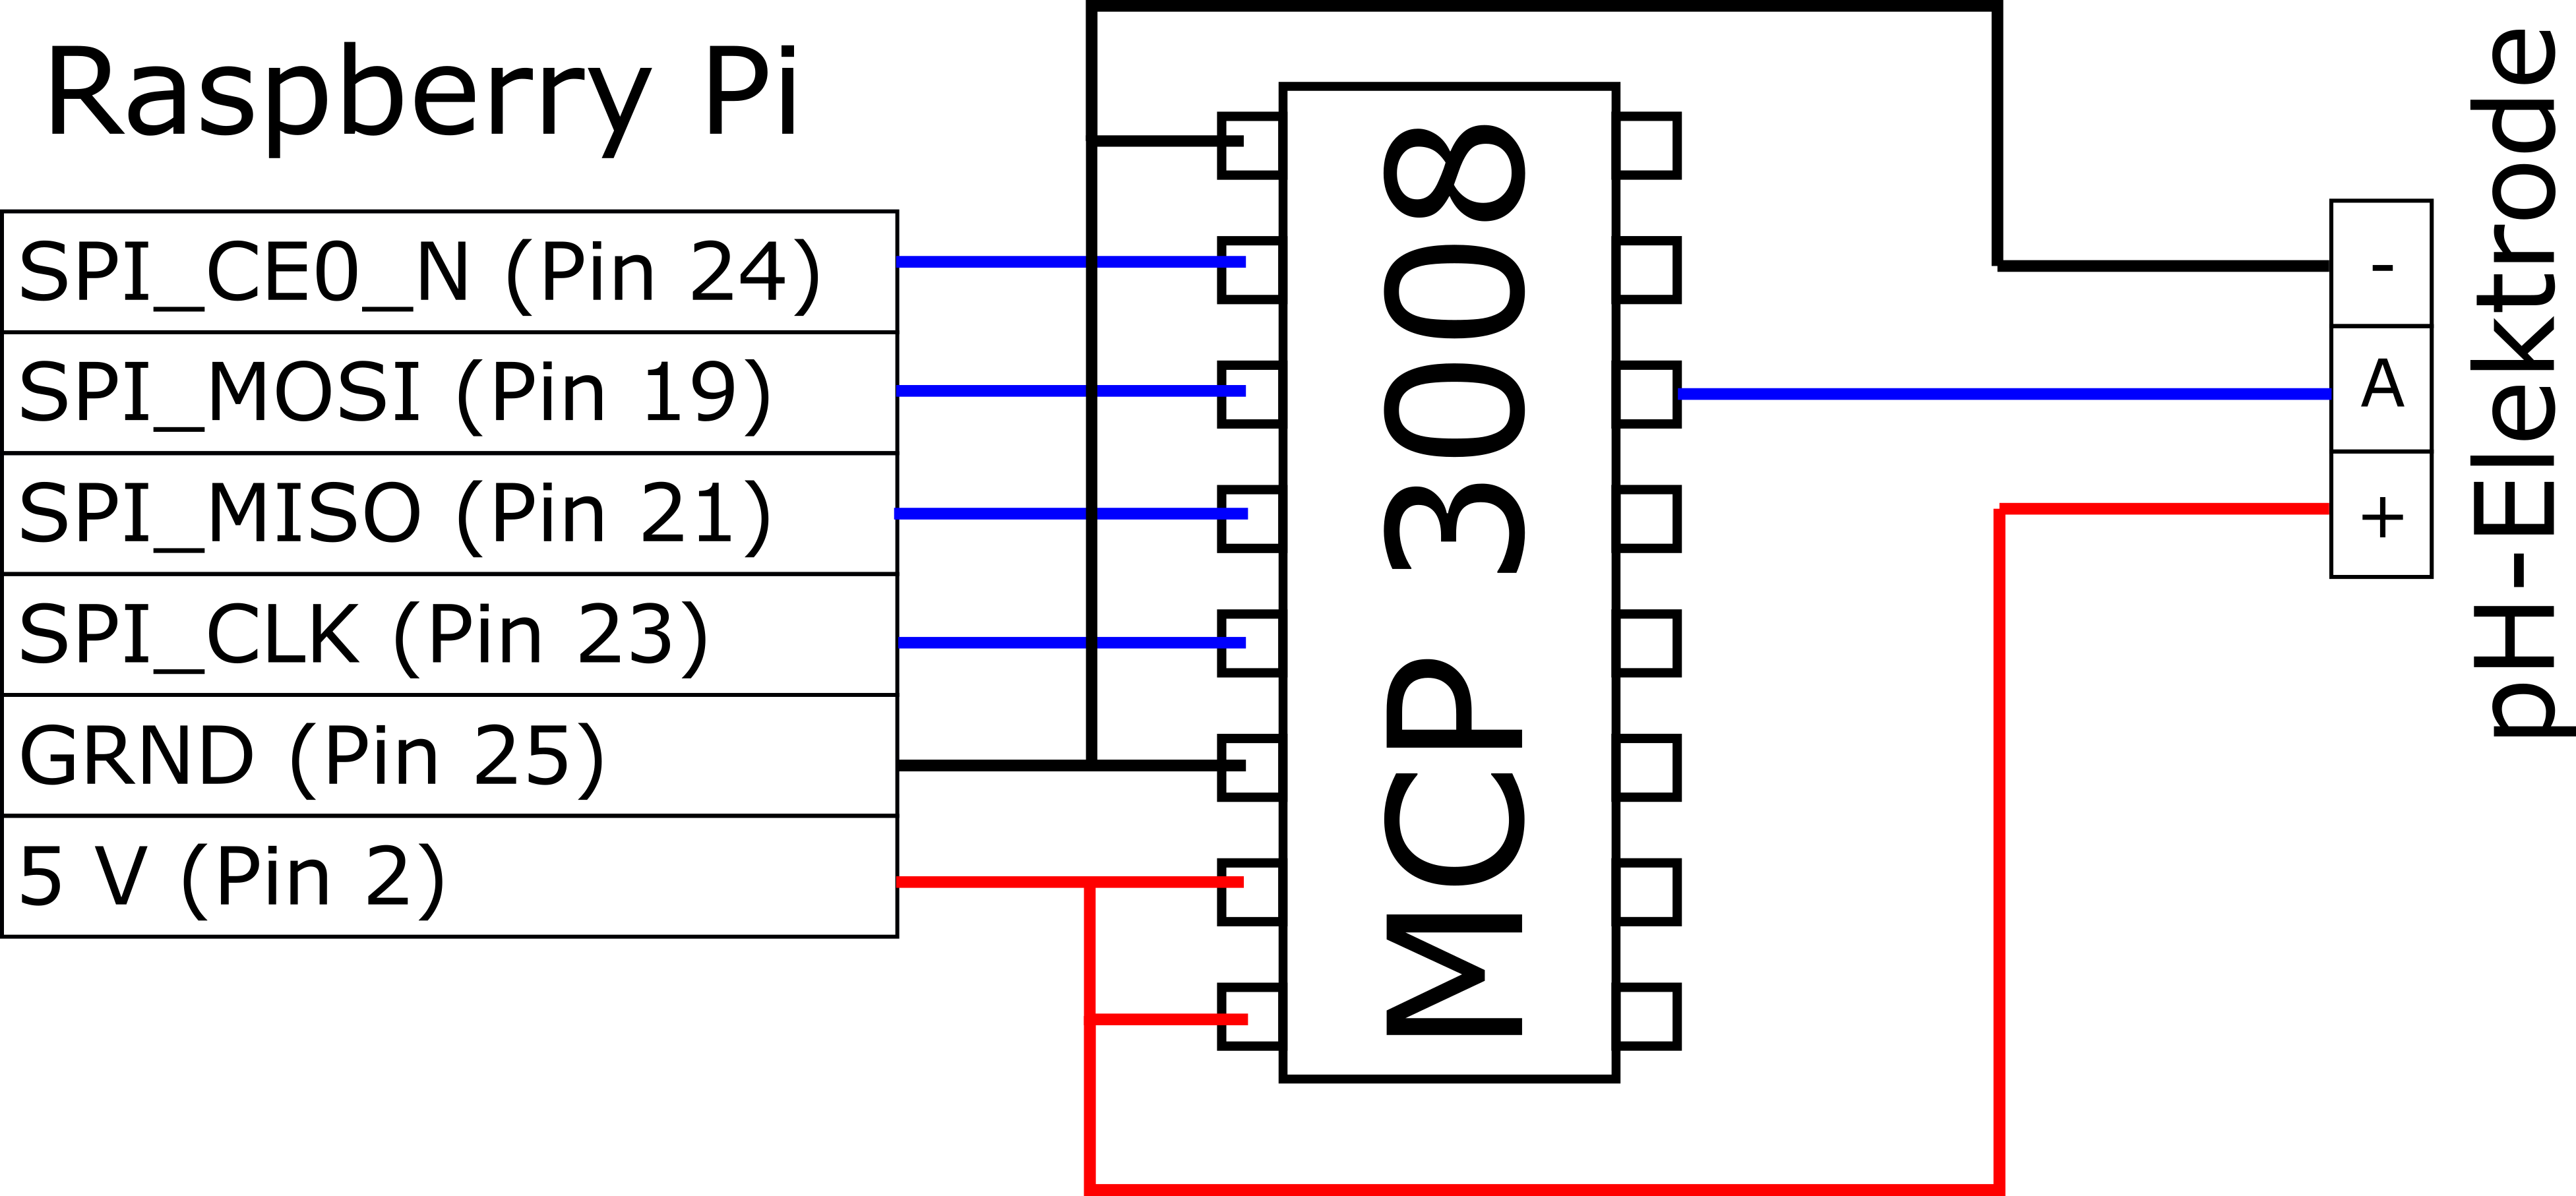
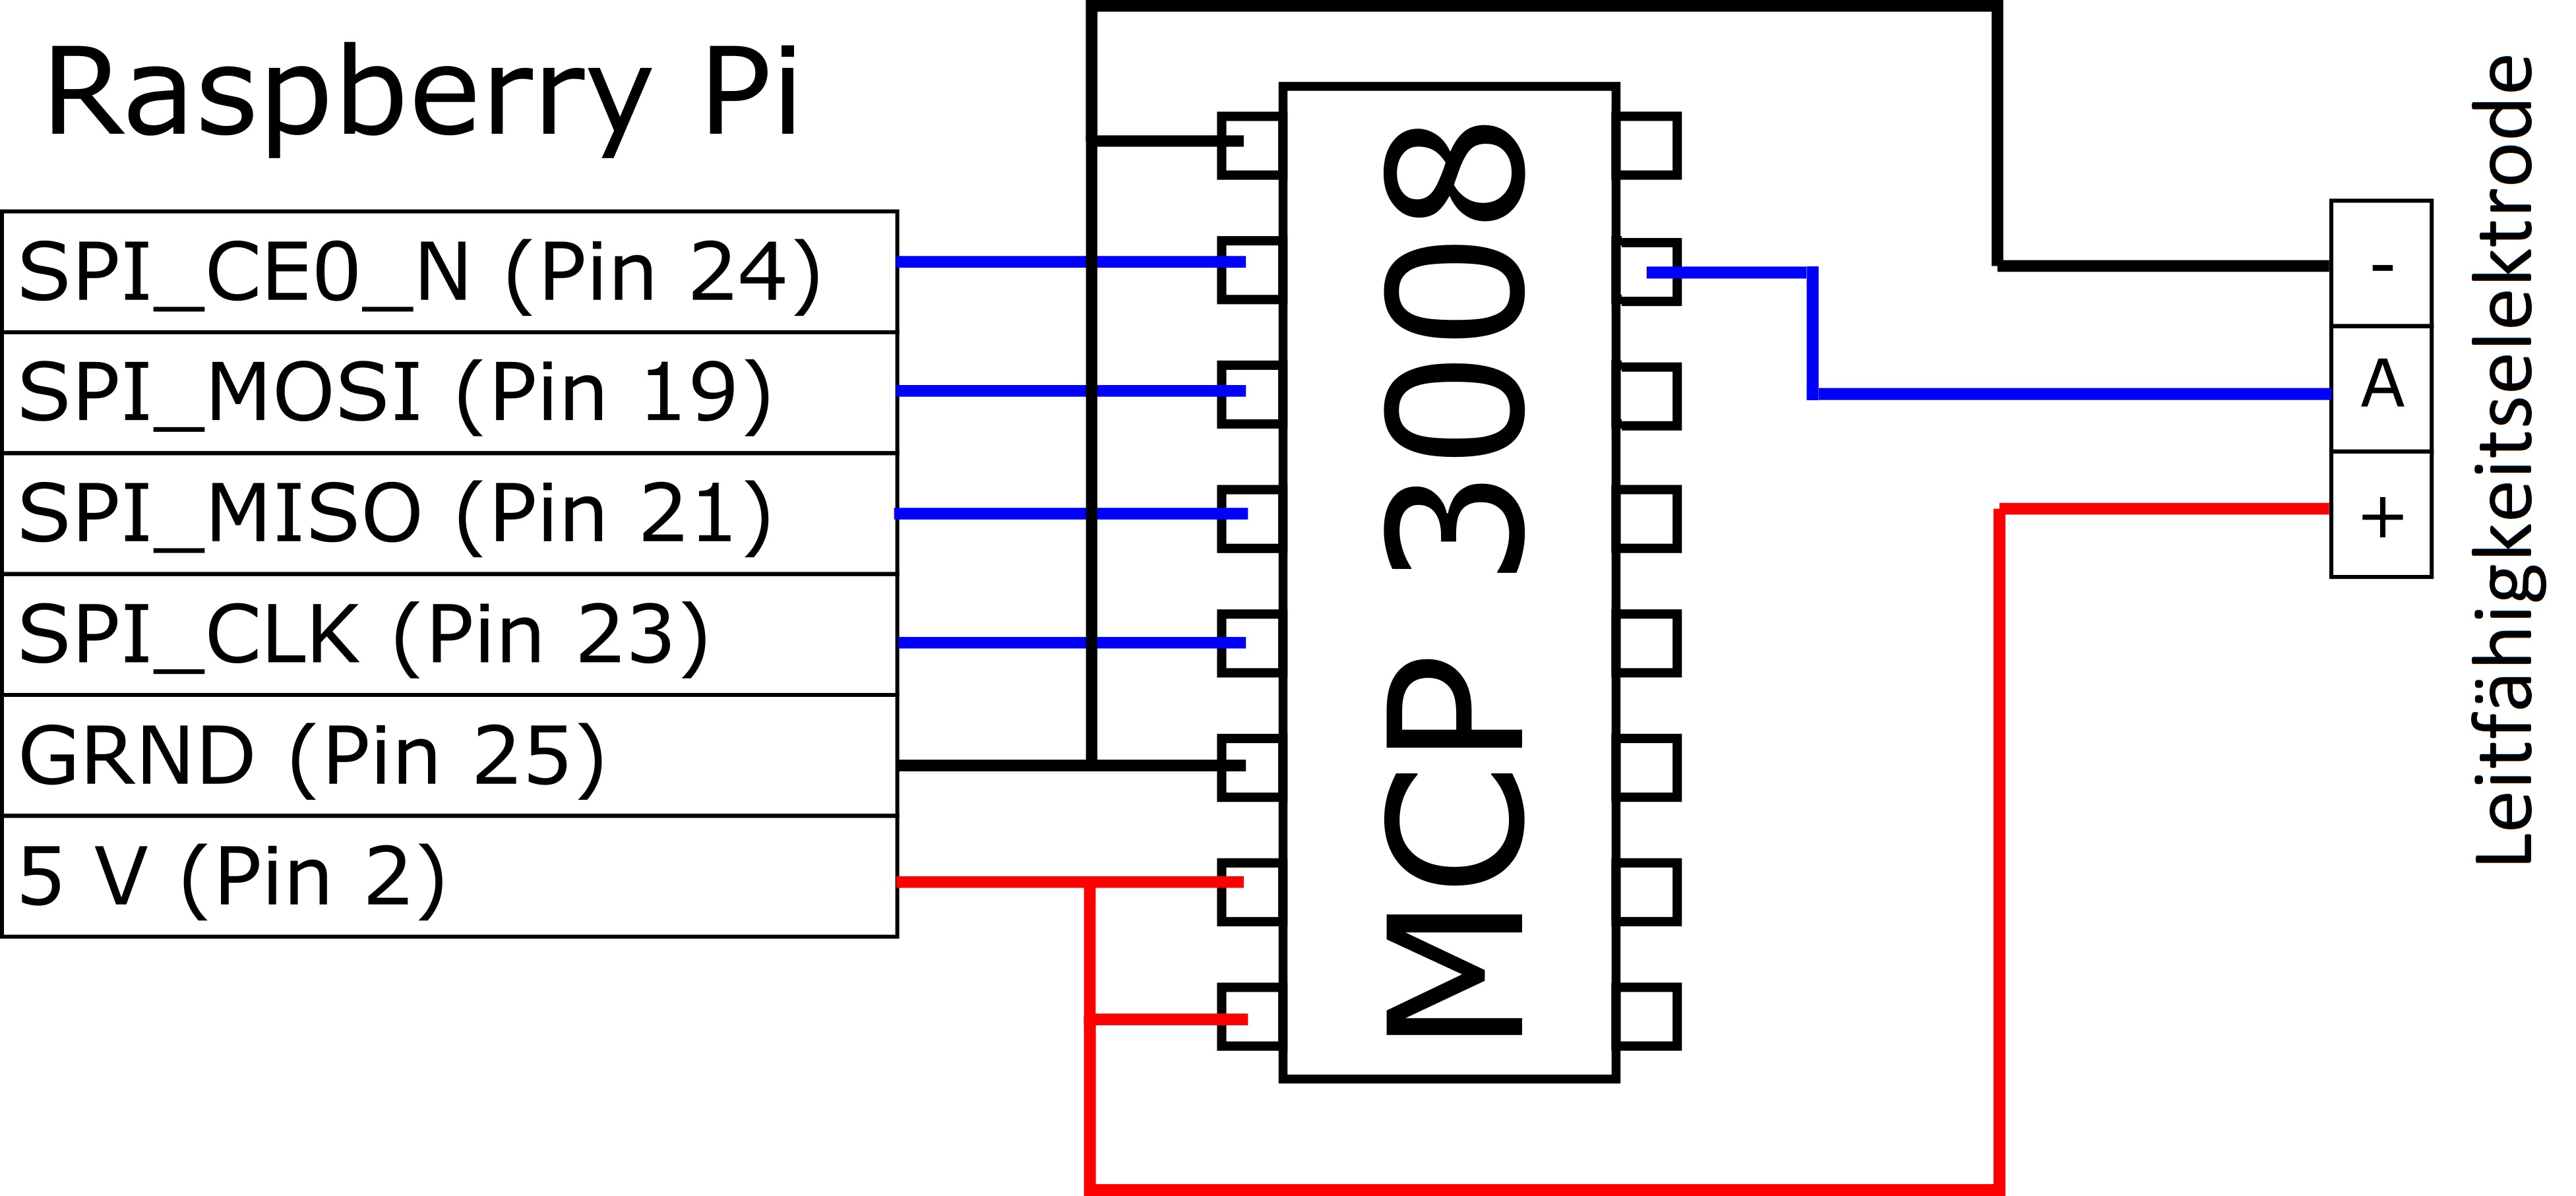
Below you will find information about connecting sensors. Please note that all specifications refer to the technical direction of current flow. To make this section easier to use, the correct Raspberry Pi GPIO assignments are shown in the figures. Section 7 contains a detailed overview of the individual GPIO pins.
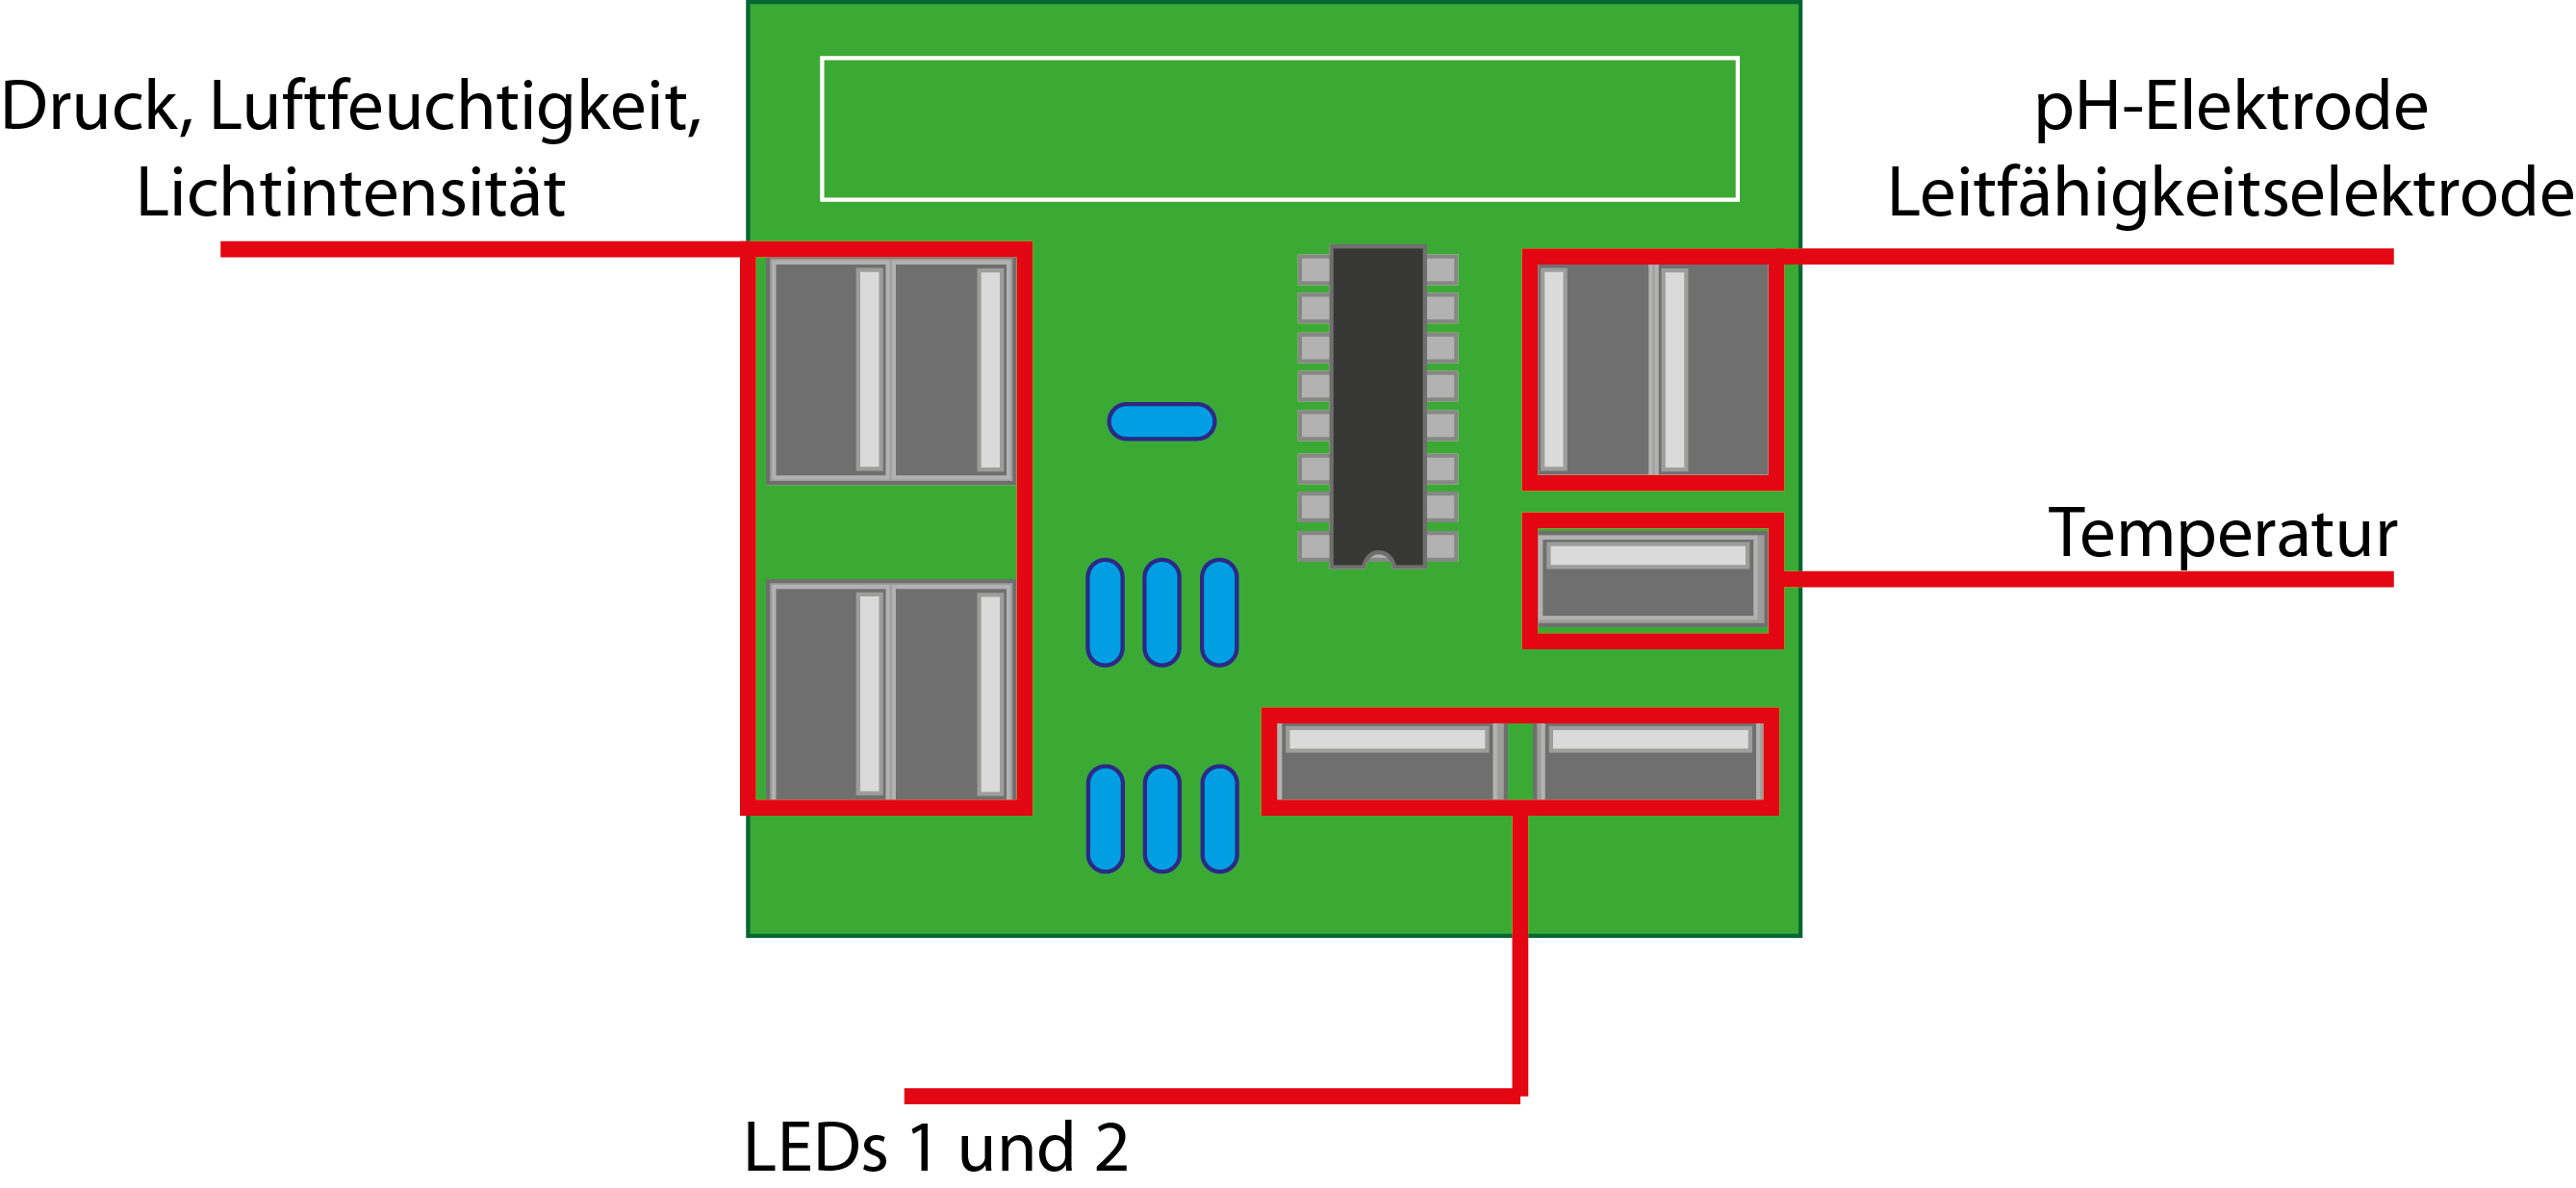
The EZBoard-G is an adapter board with nine USB slots specially developed for LabPi. The following sketch shows which USB slots can be used for each sensor.
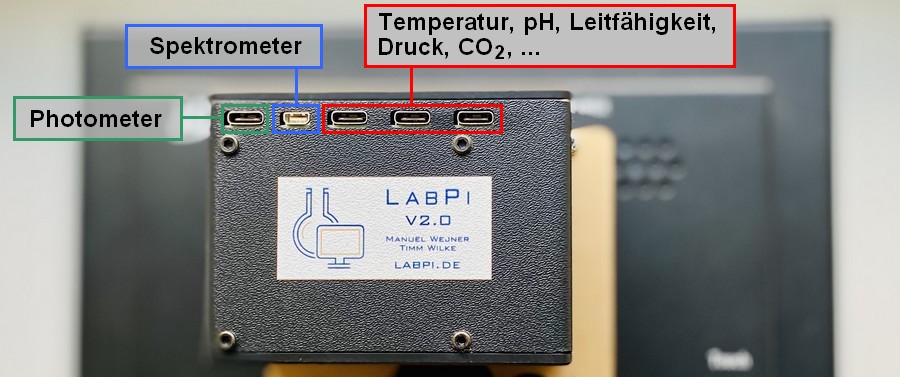
The EZBoardMini is an adapter board specially developed for LabPi with four USB Type-C slots and a micro-HDMI slot.
Which USB Type-C slots can be used for the respective sensor can be seen in the following sketch:
In order to use the conductivity electrode correctly, calibration will be necessary when using it for the first time (see Chapter 3.1).


The UVa/Vis spectrometer is currently in the development phase. This section will be added later.
In order to use the conductivity electrode correctly, calibration will be necessary when using it for the first time (see Chapter 3.1).
The gas sensor is currently in the testing phase. This section will be added later.
The humidity sensor is currently in the testing phase. This section will be added later.
The GPS sensor is currently in the testing phase. This section will be added later.
LabPi COMPare is the web interface designed for LabPi to compare series of measurements. The web interface can be accessed from any computer, smartphone and tablet via http://LabPi.de/compare.
The web interface offers you three choices:
- Show measurement series
- New measurement series
- View demo
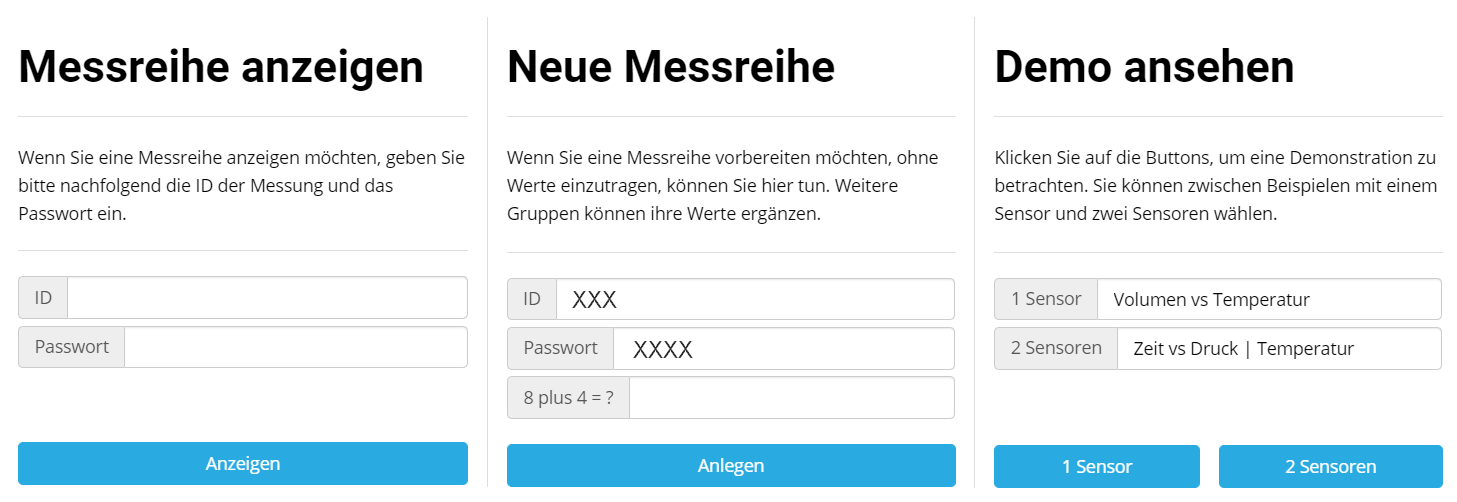
The demo gives you an insight into how LabPi COMPare displays measurement series with different sensors. You can test the individual features here even without a real series of measurements. A detailed explanation can be found in Section 5.3. Before using LabPi COMPare, make sure that your Raspberry Pi has a stable internet connection.
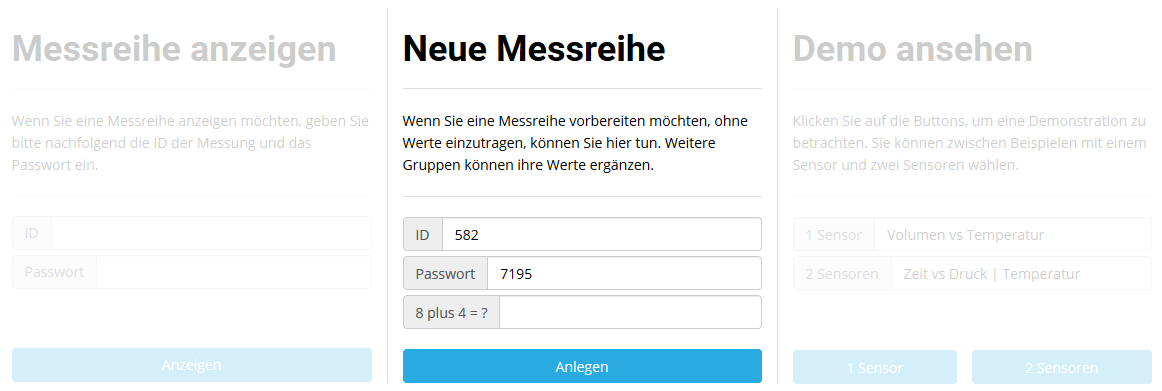
If you measure in groups, you can provide a shared template for measurement series:
- Open LabPi COMPare in the browser at http://www.labpi.de/compare/
- Under New measurement series you will be assigned an ID and a password. Write these down. The ID and password are required for section 5.2.
- Enter the security query.
- Confirm with the Create button.
- You will be redirected to an empty graphic where you will see your ID and password again at the top (make a note of these for later use).
To combine measurement series, a measurement series must first have been created as described in 5.1. Make sure the Raspberry Pi has a stable internet connection. To add another series of measurements, do the following after collecting the measurements:
- Press the Upload button in LabPi. After a short time an input window opens.
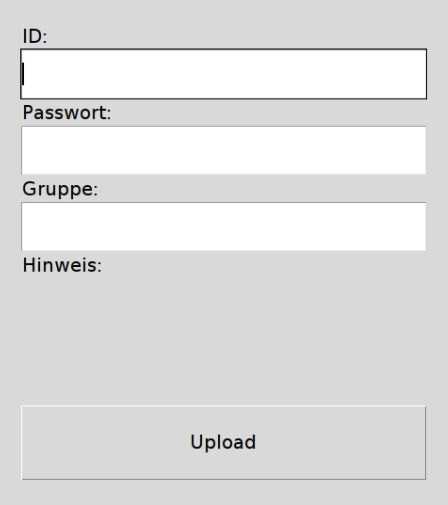
- Enter the ID assigned to you under ID.
- Enter the password assigned to you under Password.
- Enter any group name under Group.
- Confirm adding another series of measurements with Upload. After a short time, LabPi will redirect you to COMPare and show you the combined graphs.
If you have opened LabPi COMPare with your measurement series, you can also press Update to display the added measurement series.

LabPi COMPare allows you to compare series of measurements. Measurement series are usually automatically deleted if there has been no access within 30 days. To open a measurement series, proceed as follows:
- Open LabPi COMPare in an internet browser at http://www.LabPi.de/compare/
- Enter the ID and password assigned to you under Show measurement series.
- Press the Show button. You will be redirected to your measurement series.
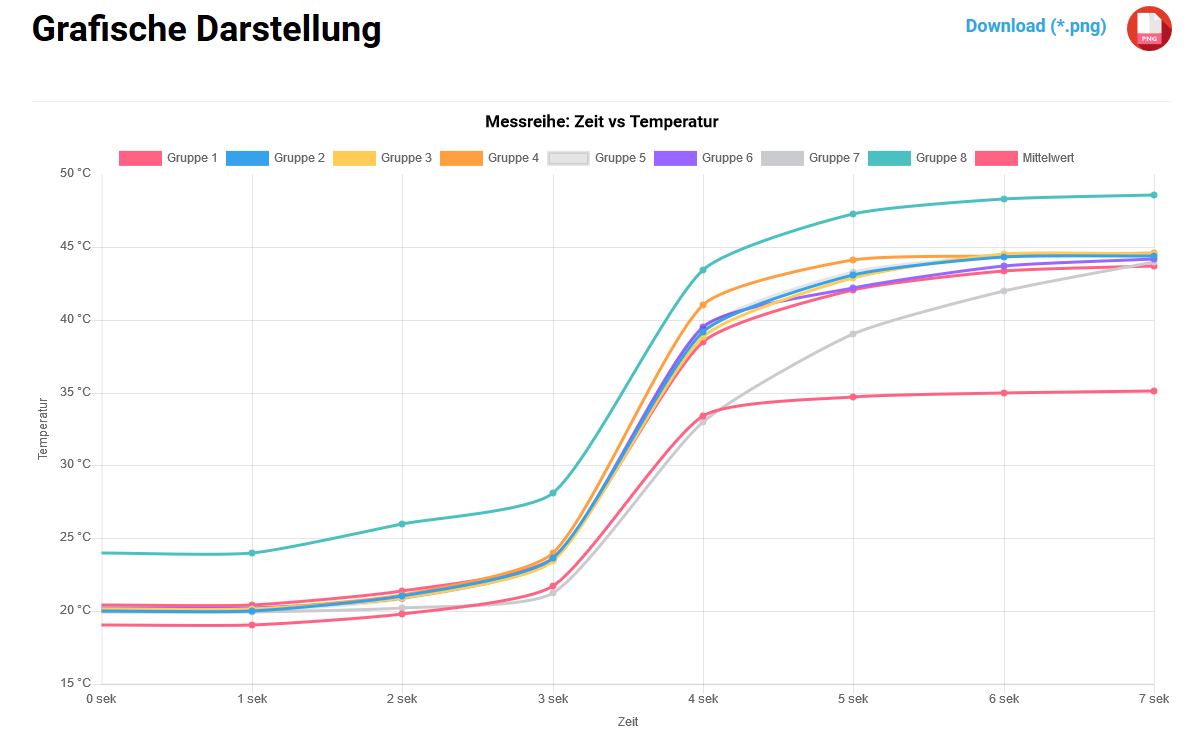
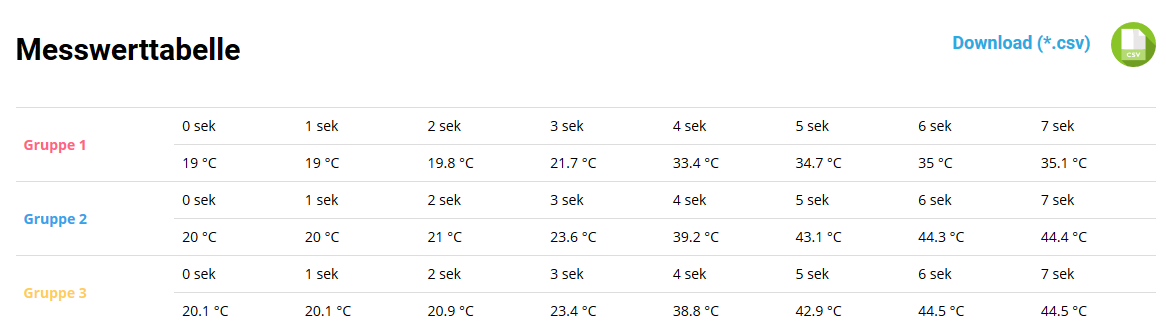
LabPi COMPare gives you a graphical representation of the measurement series. The individual groups are indicated in color above the graphic. You can hide individual groups by clicking on the respective group name or color (Graphical display).
Below the graphic, the measured values determined are shown in a table according to groups and finally as an average value (Measured value table).
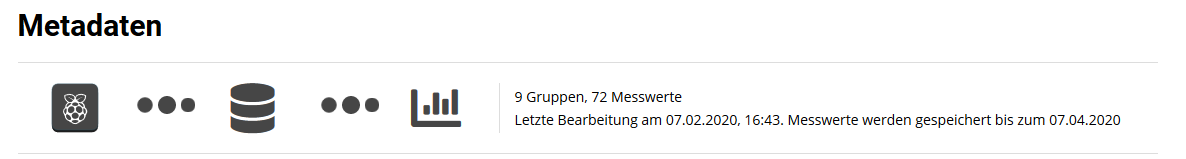
The Metadata section (can be found under the measurement table) shows you how many groups/measurement series were recorded and how many individual measurements there were. You will also be shown up to which date the measured values will be saved by LabPi COMPare (usually 30 days after the measurement series was last opened).
You can export measurement data that is available in COMPare in two ways and download it for further use.
- Graphic application
To download the graphical plot, please right-click on the desired graphic in LabPi COMPare. Then select "Save image as..." and confirm by clicking on "Save". 0
- Measurement data
To export the measurement data, click on the “Download (*.csv)” button. By clicking on Save you can download the measurement data in CSV (comma-separated values) format. This format can be imported with all common spreadsheet programs (Excel, LibreOffice, ...).

Import the CSV file into Excel:
To import the CSV file, do the following:
- Open a new file in Excel
- Click on “Data” in the top tab, then click “From Text/CSV” in the top left corner
- Select the downloaded file. Then click on “Load”.
The process is shown in the video below
The live upload will be activated in version 0.24 and enables the transmission of measured values in real time and thus also much larger amounts of data.
Exporting two sensors to LabPi COMPare is not yet possible.Fixed!Data acquisition for large time measurements with small measurement intervals (e.g. measurement duration: 180 s, measurement interval: 1 s) is not possible without errors.Fixed! Will be corrected in version 0.24- Deleting and resetting the values in LabPi leads to various difficulties (text area is not updated correctly; only the last deleted measure or all measures can be restored).
- Exported graphics display labels too small.
Jumper cables that are too long may be used for the connection, which increases the internal resistance of the electronics.
Check the connections according to Section 4 (Connecting sensors). Make sure the cable length does not exceed 15cm for accurate measurement.
The conductivity electrode influences the measurements of the pH electrode by applying a voltage. This can be bypassed using a relay circuit, which is not yet supported in the current version of LabPi.
- pH electrode:
Gravity: Analog pH Sensor / Meter Kit for Arduino (www.sha256systems.eu)
ADC: MCP3008 - Conductivity electrode:
Gravity: Analog Electrical Conductivity Sensor / Meter for Arduino (www.sha256systems.eu)
Includes conductivity electrode and temperature sensor
ADC: MCP3008 - Temperature sensor:
Gravity: Waterproof DS18B20 Sensor Kit (www.sha256systems.eu)
Alternatively: DS18B20 / DS18S20 with resistor (4.8 kΩ) (www.conrad.de) - Air pressure:
BMP180 (www.amazon.de) - Photometer:
TSL2561 – light intensity sensor (www.amazon.de)
RGB LED with common cathode (www.amazon.de) - Humidity:
DHT22 (www.amazon.de)
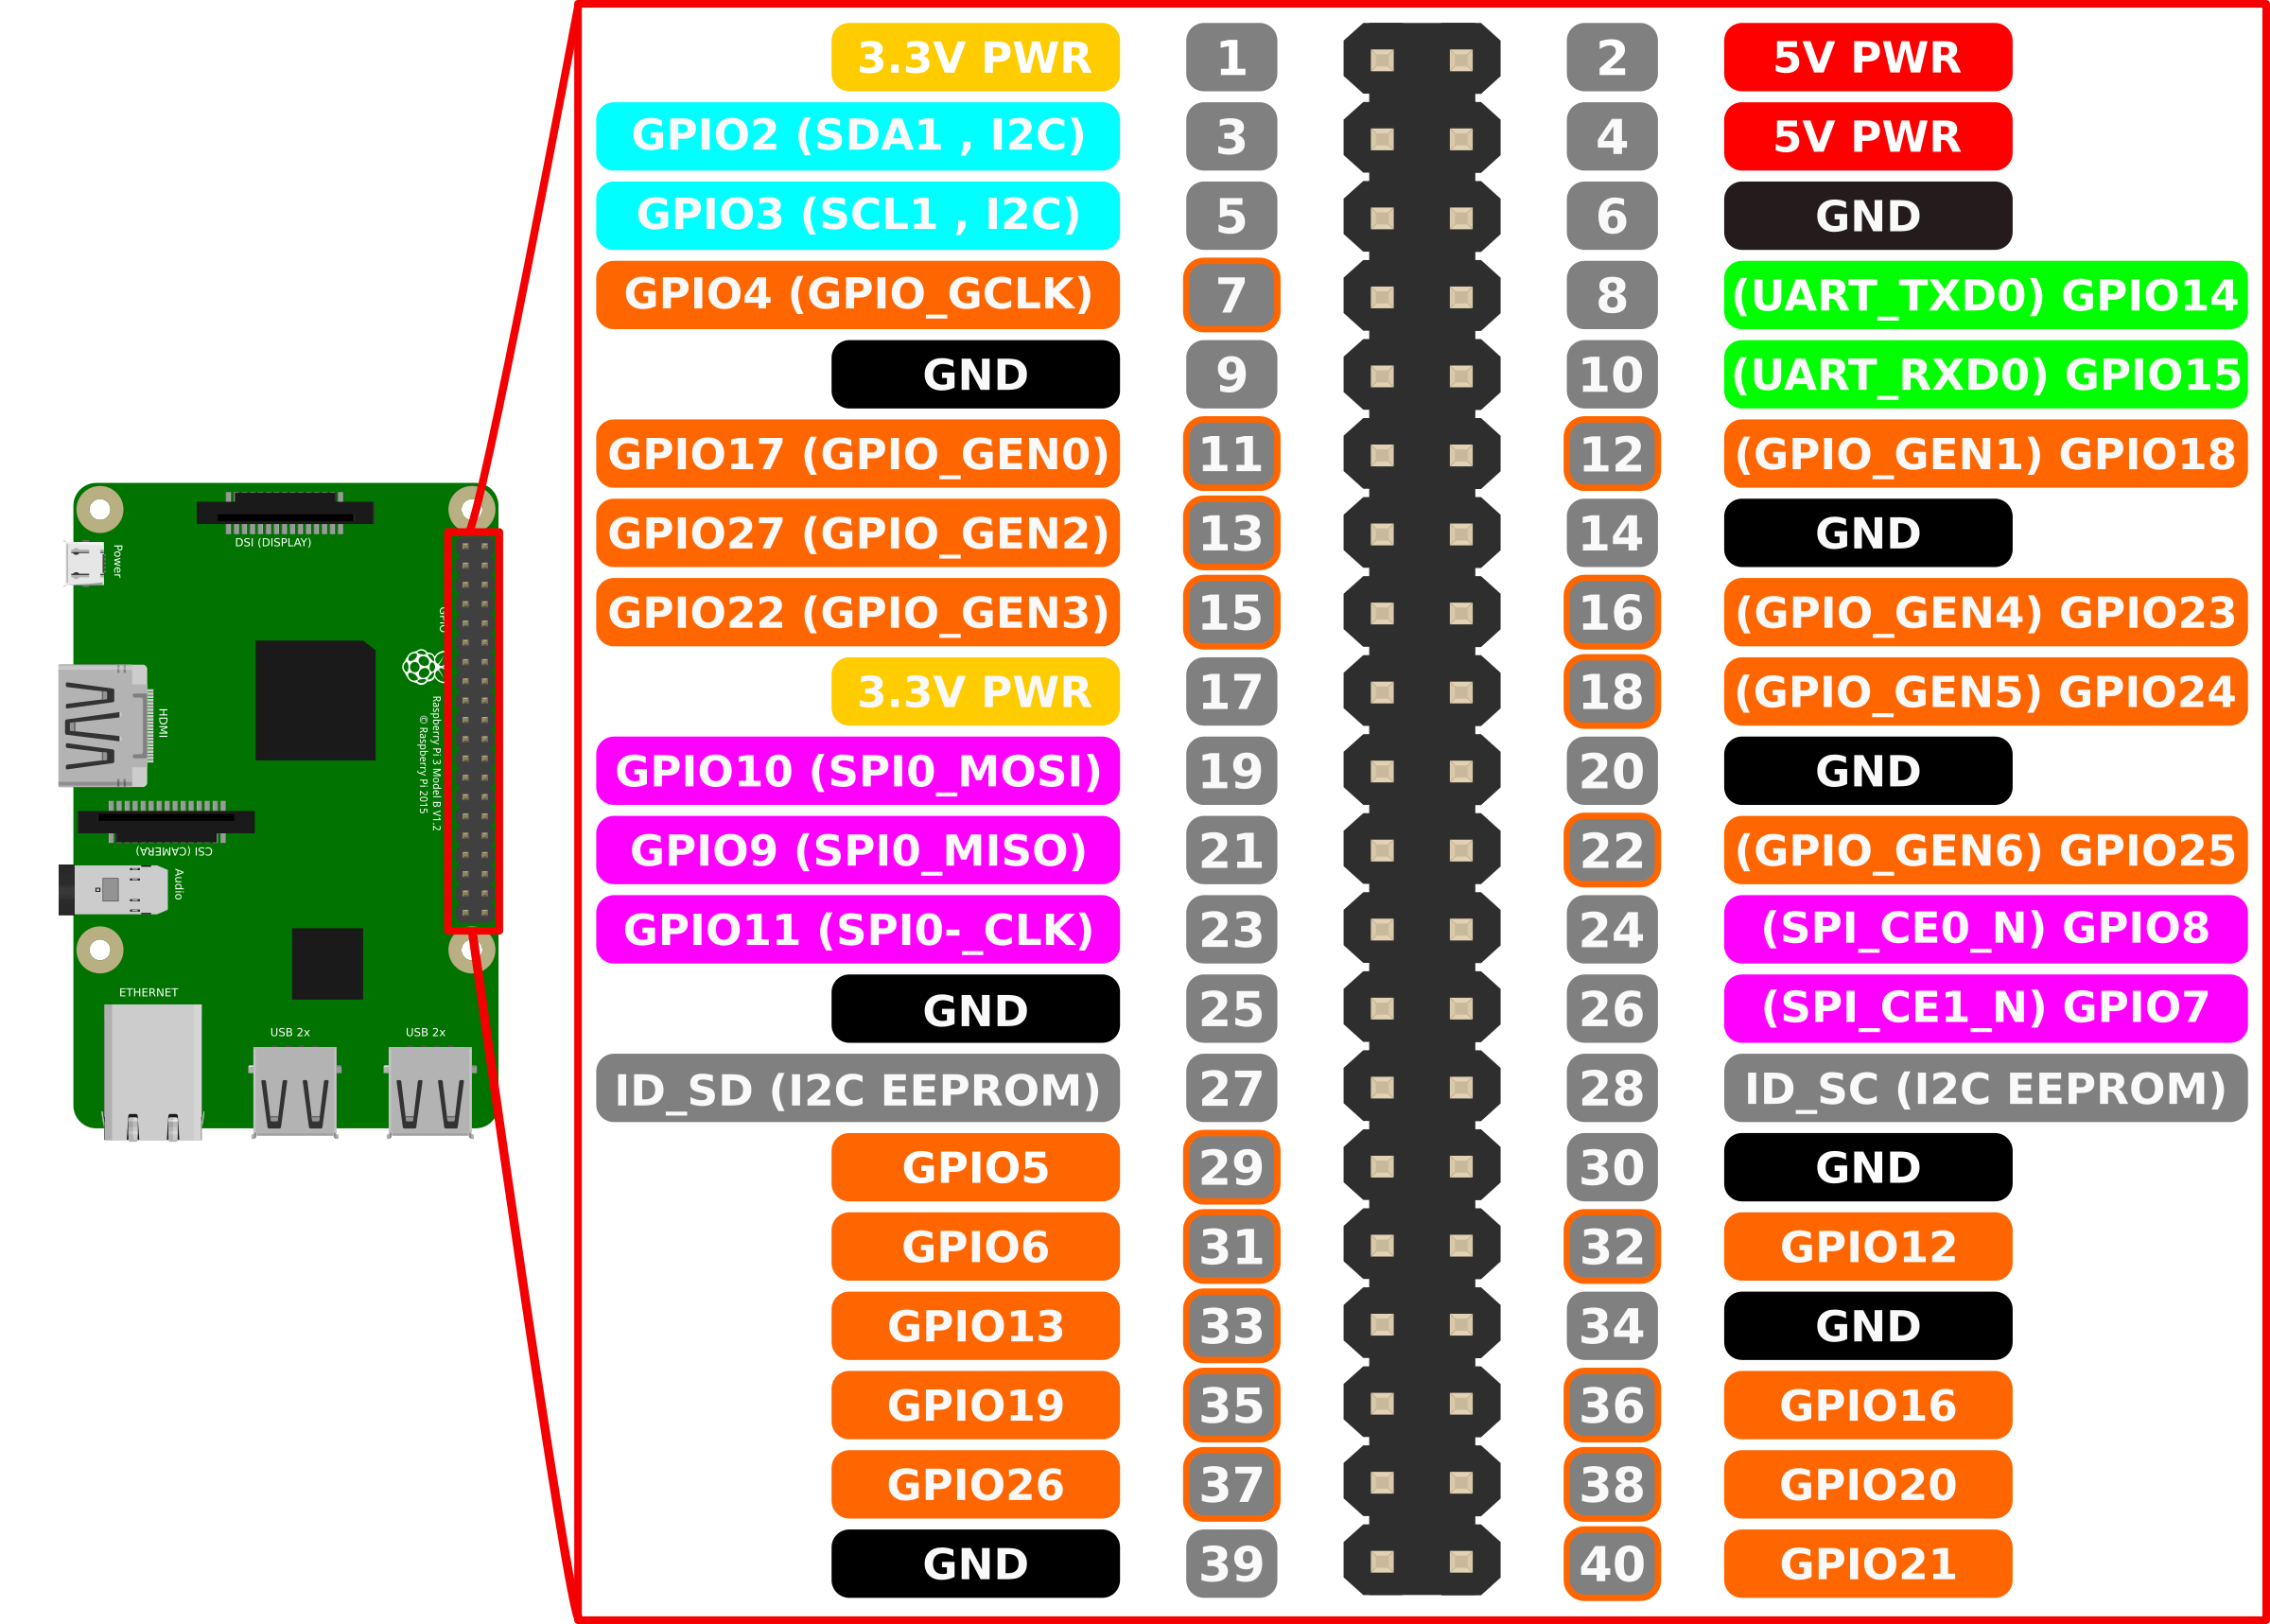
Source: https://openclipart.org/image/2400px/svg_to_png/280972/gpiopinsv3withpi.png

Manuel Wejner
Development of LabPi
Friedrich Schiller University Jena
Didactics of chemistry
August-Bebel-Str. 2, 07743 Jena
Tel. +49 3641 9-48946
Email: manuel [dot] wejner [at] uni-jena.de

Prof. Dr. Timm Wilke
Development of LabPi COMPare
Friedrich Schiller University Jena
Didactics of chemistry
August-Bebel-Str. 2, 07743 Jena
Tel. +49 3641 9-48943
Email: timm [dot] wilke [at] uni-jena.de